Kapalama Container Terminal Electrification Plan: Showcasing Sustainable Port Operations
This blog post by the Clean Coalition details the Terminal Electrification Plan for Kapalama Container Terminal in Honolulu, Hawaii.
Kapalama Container Terminal Electrification Plan: Showcasing Sustainable Port Operations
The Kapalama Container Terminal (KCT) in Honolulu, Hawaii, operated by Pasha Group and Hawaii Stevedores Inc., is set to become a showcase for sustainable port operations. This modern facility is embarking on an ambitious Terminal Electrification Plan, with the Clean Coalition guiding a comprehensive strategy anchored by our Solar Microgrid Methodology (SMM). The project aims to demonstrate how ports can successfully electrify their operations while achieving high levels of Net Zero Energy (NZE) through onsite renewable energy. The plan will unfold over two phases and address the unique challenges and opportunities presented by KCT’s large site, substantial energy demand, and strict resilience requirement.
Unique features of the KCT Terminal Electrification Plan
The KCT electrification and resilience project presents several distinctive features that make it a complex endeavor. Much of the terminal (electrical infrastructure, buildings, parking lots, cranes, etc.) is already designed and built, and the Clean Coalition is responsible for maximizing solar and battery energy storage systems (BESS) on the site while respecting the space constraints of terminal operations. Integrating new energy systems into a large, complex site requires careful planning and adaptation. One novel and critical need at KCT is the charging loads from new electrified cargo handling vehicles Additionally, KCT will incorporate five all-electric cranes with the capability to regenerate energy as they lower shipping containers onto the terminal or onto shipping vessels. Most importantly, the Terminal Electrification Plan is a resilience plan: the terminal requires a strict minimum of 36 hours of microgrid autonomy to unload food and other critical cargo, which dictates the sizing of on-site BESS capacity and solar generation. The Clean Coalition has the policy, technical, and management expertise for complex projects like these, most of which is consolidated in our Solar Microgrid Methodology (SMM).
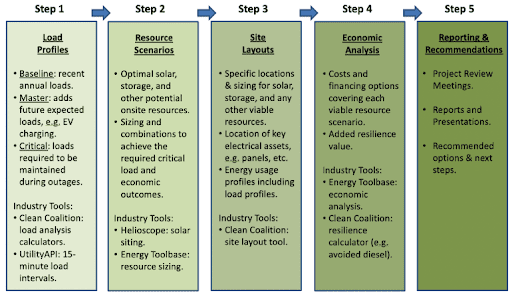
The Clean Coalition’s 5-step Solar Microgrid Methodology
Phase 1: Inventory and Assessment
The Clean Coalition’s work on the KCT Terminal Electrification Plan began with a comprehensive assessment of the site and its energy needs. This initial phase, crucial for laying the groundwork for the entire project, follows the Clean Coalition’s SMM.
Site Walk and Load Profiles
A team of Clean Coalition engineers conducted a thorough site visit at KCT, collaborating closely with the project’s engineering and operations staff. This on-the-ground assessment was critical for creating an inventory of the current electrical infrastructure and evaluating the potential for renewable energy integration. By physically examining the terminal, we gained insights into the site’s unique characteristics and challenges.
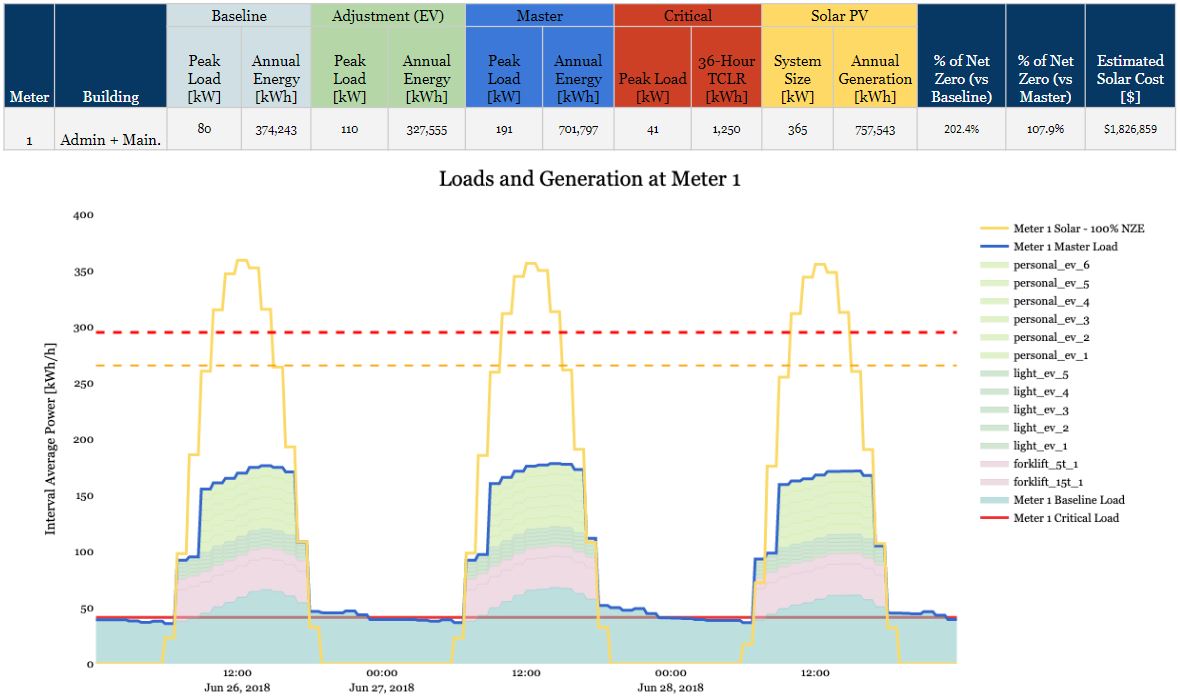
With a clear understanding of the site’s layout and infrastructure, we moved on to the task of load profiling. This step involves creating four key load profiles: Baseline, Adjustment, Master, and Critical. These profiles are essential for informing the sizing of project resources and evaluating the site’s capacity to accommodate them. Our analysis considered various resources, including solar, BESS, EVs, and potential wind generation.
Results of assessment of key load profiles at KCT’s Meter 1
Resource sizing
With comprehensive load profiles, we proceeded to Step 2 of Clean Coalition’s SMM: Resource Sizing. Our analysis determined that solar installations should be sited at 7 of 9 KCT meters, while BESS units should be located at 4 of the 9 meters. Using the Master Load Profile as our guide, we sized the solar capacity with the goal of achieving 100% Net Zero Energy (NZE), or as close to it as possible given the available space.
We found that the best configurations include both solar parking canopies and rooftop solar installations. Solar siting is difficult near the meter that serves the all-electric cranes, so we are investigating wind generation options and additional battery storage. While the current BESS sizing at the cranes meets the 36-hour requirement, adding wind generation could further enhance the economic and operational benefits.
BESS Sizing for Resilience
One of the most critical aspects of our assessment was determining the BESS sizing to meet KCT’s strict 36-hour resilience requirement. This analysis leveraged our advanced Solar Microgrid Analysis Platform (SMAP), which calculated the necessary BESS size for each critical meter. The SMAP analysis incorporated several key factors: Baseline Load Profiles, the 36-hour critical load profiles (excluding non-critical loads like EV charging), the solar generation profiles, the battery round-trip efficiencies, and degradation for both solar and BESS through the project’s lifetime.
The results provided the required BESS size for Year 1 to cover a 36-hour outage with specific probability levels. For instance, at Meter 1 (which serves Administration and Maintenance buildings), we calculated that a minimum 920 kWh BESS is needed to ensure 100% coverage of the 36-hour requirement, but the BESS size can be reduced by a third if if KCT could accept a 95% chance of meeting the 36-hour autonomy requirement. This analysis was conducted for 4 of the 9 meters to meet the project’s resilience requirements.
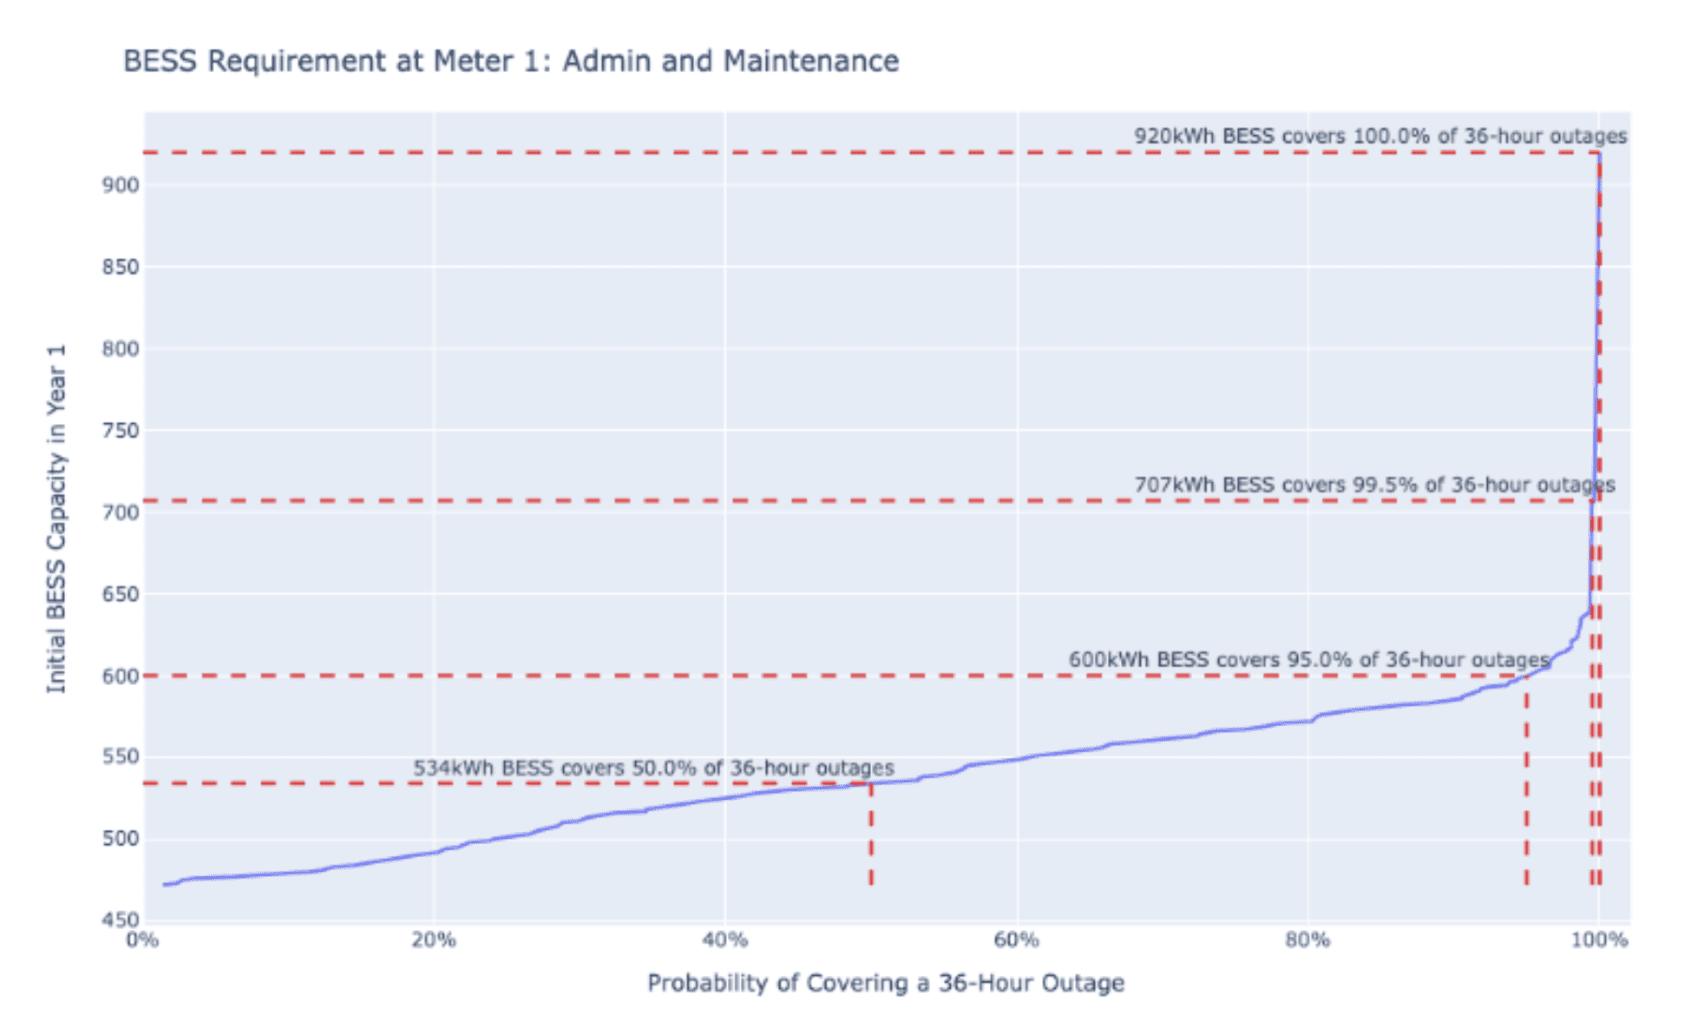
BESS Sizing Results for Meter 1 demonstrates that significant BESS Capacity (920 kWh) is required to fulfill KCT’s strict 36-hour resilience requirement in year 1.
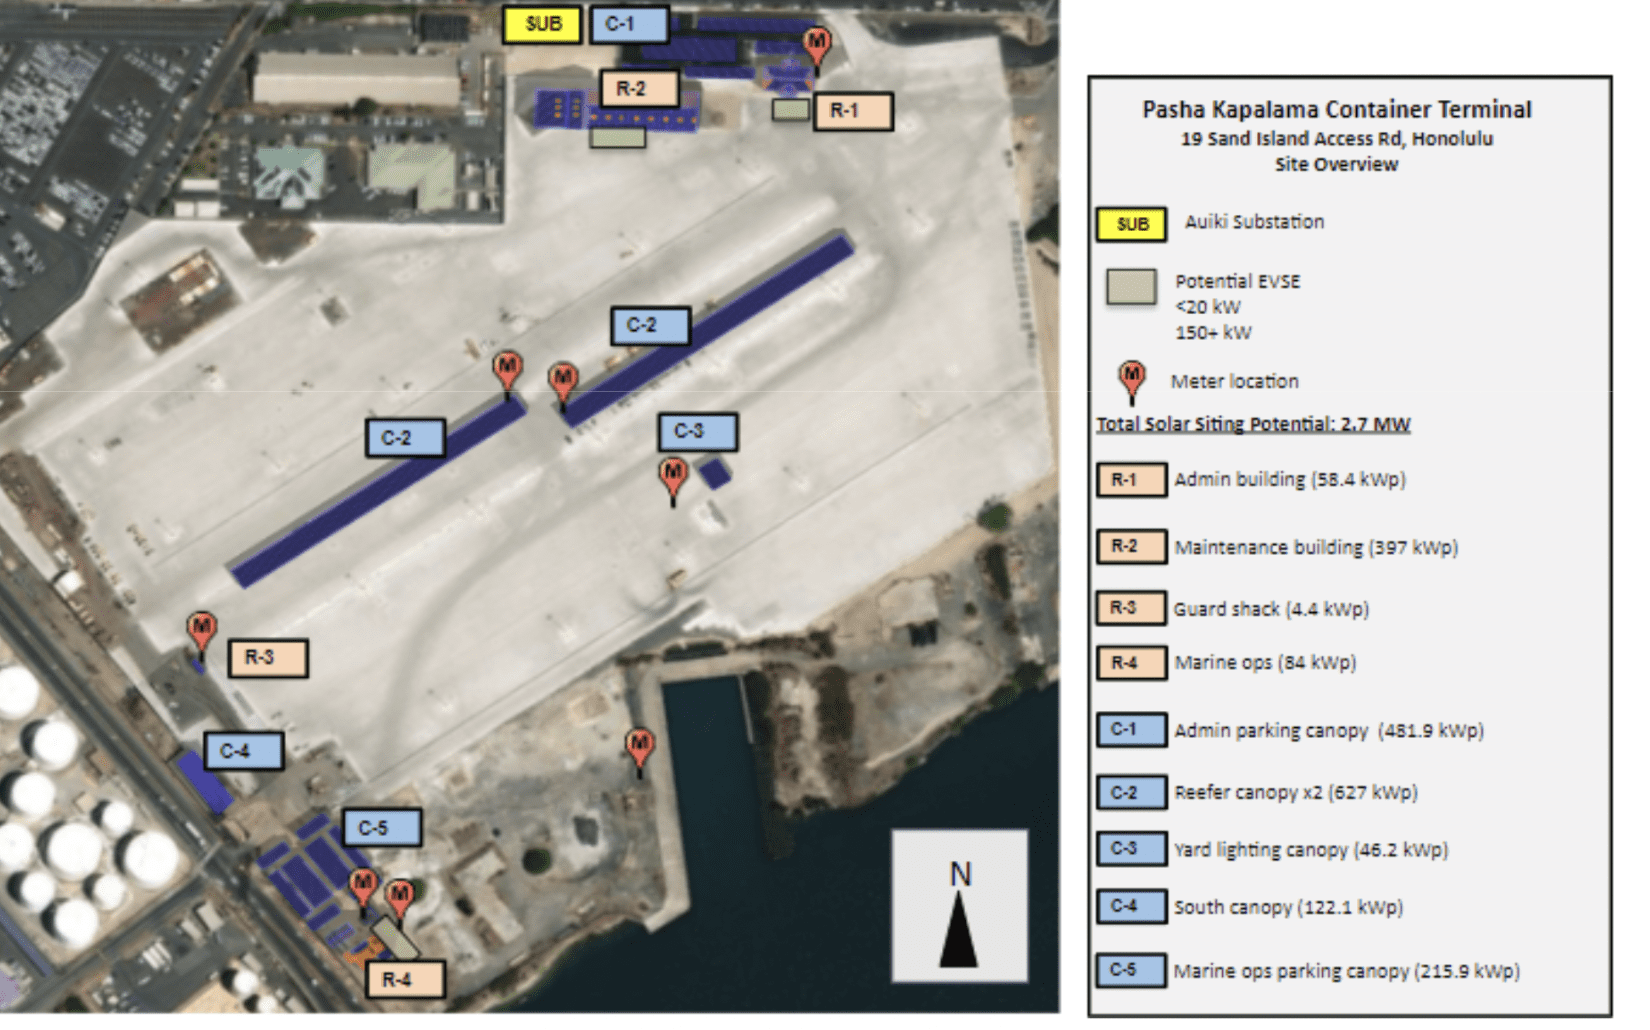
Site layout
With resource sizing complete, we moved to develop comprehensive site layouts. These visual representations are crucial for understanding how solar, BESS, EV charging, and existing electrical assets will interact and integrate within KCT’s infrastructure. We created two types of layouts including a block diagram format for general overview and a detailed top-down perspective for precise visualization.
These layouts serve multiple purposes. They allow the project team to assess the feasibility of proposed solutions, identify potential challenges, and make informed decisions about equipment placement and interconnection. Perhaps most importantly, these simple graphics help communicate the project’s vision to stakeholders and potential partners, particularly for a future Request for Proposal (RFP) stage.
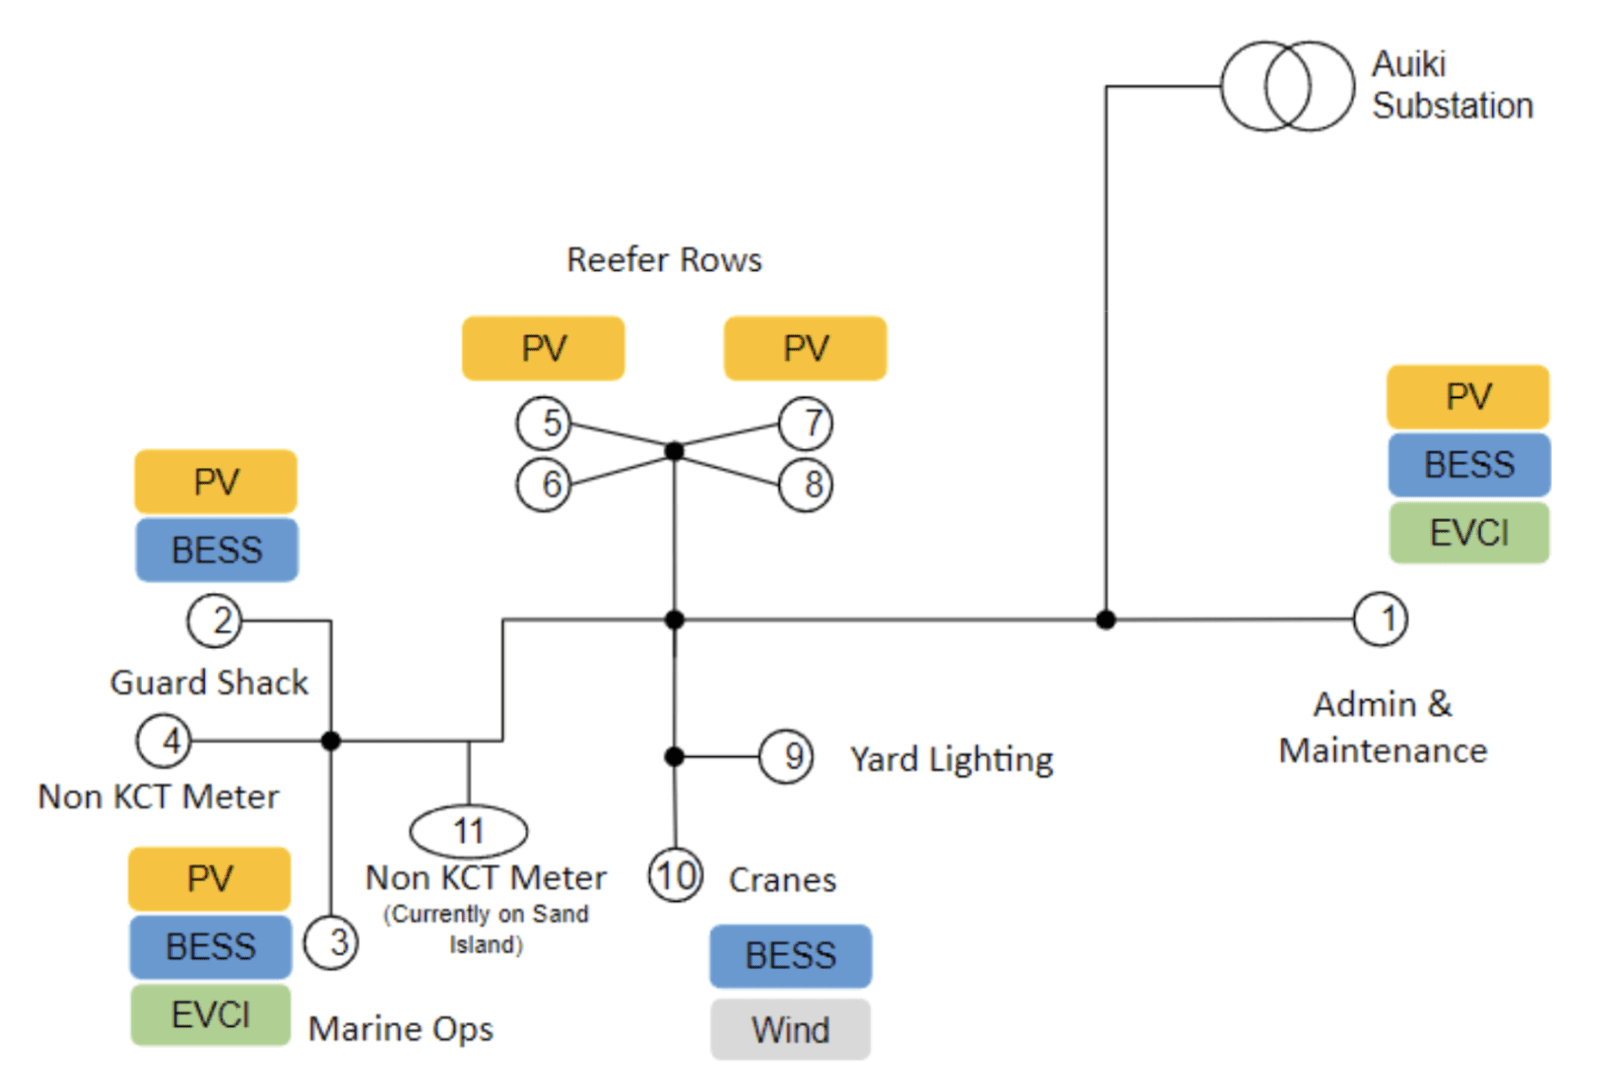
Block diagram of KCT’s site layout demonstrating the general location and resources at each meter
Top-down detailed site layout for detailed visualization of the KCT site
Economic Analysis
As we conclude Phase 1, our focus shifts to a comprehensive economic analysis. This step will provide insights into the economic savings for each meter, based on a cash purchase transaction over a 25-year period. This analysis will consider rate schedules, capital expenditure, operational expenditure, available federal and state incentives, and strategies for optimizing system performance for economic purposes while grid-connected through energy arbitrage and demand charge management.
Phase 1 lays a solid foundation for KCT’s Terminal Electrification Plan. The insights gained and strategies developed during this phase will guide our work moving into Phase 2, where we will refine our recommendations and develop the final Terminal Electrification Plan.
Phase 2: Detailed Assessment
In Phase 2, we will delve deeper into the recommendations outlined in the Preliminary Terminal Electrification Plan. This phase will involve refining estimates for on-site load and generation, identifying specific product recommendations, prioritizing administrative steps, and establishing representative timelines for all actions. Additionally, the Final Terminal Electrification Plan will develop supplemental technical reports on specific topics such as microgrid operations, electric vehicle charging, and innovative generation and storage components. These reports will serve as valuable guides for future engineering studies and procurement processes.
The KCT Terminal Electrification Plan represents a groundbreaking showcase for sustainable port operations, offering a major resilience benefit to Oahu and substantial cost savings to Pasha Group over the terminal’s operational lifetime. As we conclude Phase 1 and progress through Phase 2, we anticipate that this project will serve as an exemplary model for ports worldwide, demonstrating the feasibility and benefits of comprehensive electrification strategies while achieving high levels of NZE. By integrating innovative renewable energy solutions, KCT is setting a new standard for environmentally responsible and operationally efficient maritime infrastructure. The Clean Coalition remains committed to leveraging our expertise in Solar Microgrid planning and design to ensure the success of this transformative project. As we move closer to implementation,we look forward to sharing further updates and insights from this showcase initiative, paving the way for a sustainable future in port operations globally.