Energy Tetris Part 2: A Practical Blueprint for Integrated Grid Planning in California
This blog post by the Clean Coalition explains Energy Tetris as a crucial blueprint for Integrated Grid Planning in California.
Energy Tetris Part 2: A Practical Blueprint for Integrated Grid Planning in California
Energy Tetris only works when all the pieces are on the same board. California is still stacking generation on one board and building wires on another—optimizing energy while making the grid more expensive by design.
California is facing the perfect storm of energy unaffordability, renewed load growth for the first time in nearly two decades, and escalating climate impacts. Yet the state’s energy planning processes were designed for a 20th-century grid without bi-directional power flows or distributed resources, and they therefore solve the wrong optimization problem. Optimizing generation around a least-cost, best-fit portfolio inevitably produces transmission-interconnected resource stacks while leaving infrastructure costs largely unexamined. That approach misses the mark on affordability: more than two-thirds of a customer’s electricity bill is driven by transmission and distribution spending. Each planning cycle that remains generation-centric—rather than focused on minimizing incremental infrastructure and maximizing net system value—perpetuates rising costs.
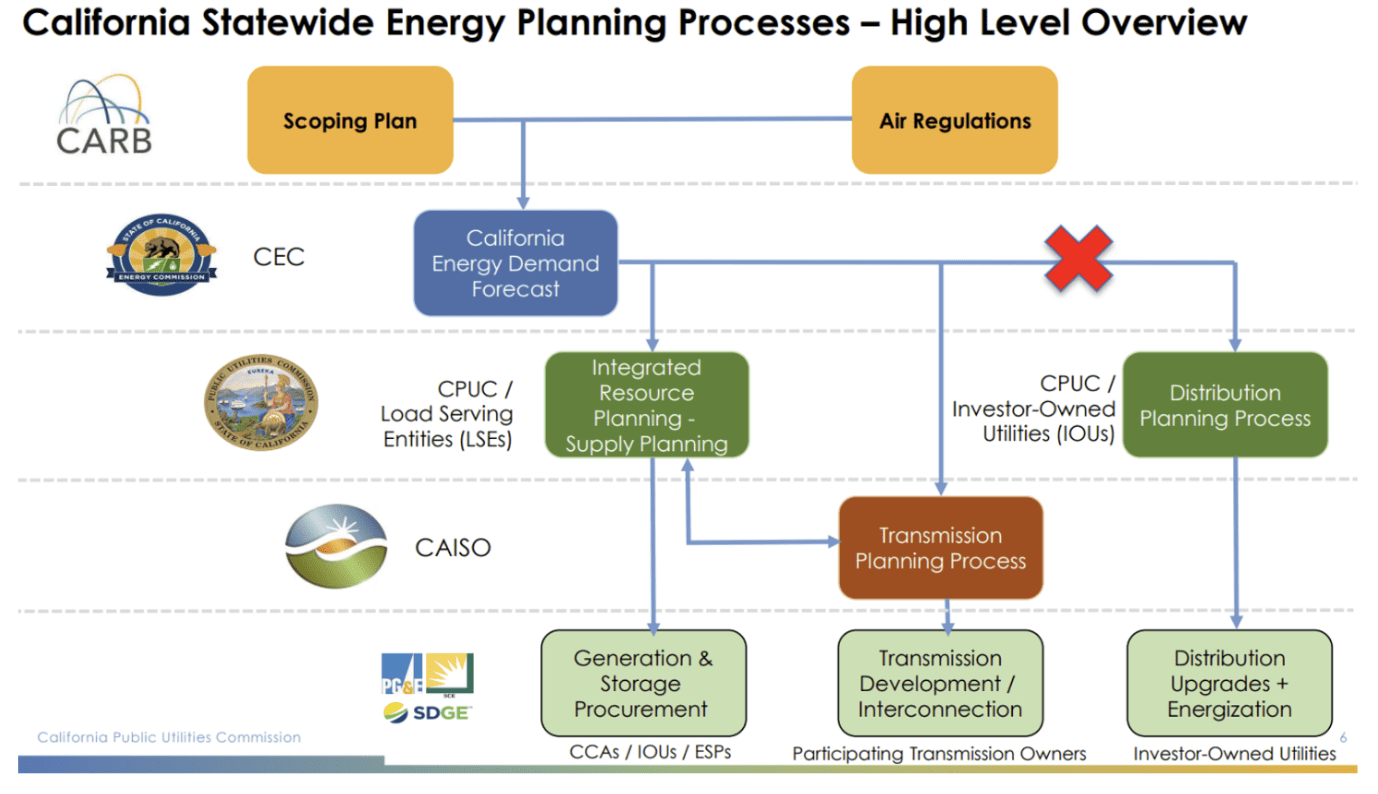
Efforts to control rising electricity costs have largely focused on adjusting customer-facing programs such as energy efficiency. Yet these programs are not the primary drivers of long-term infrastructure spending; in fact, they have contributed to two decades of stable load growth in the CAISO balancing area. The root cause lies in planning structures designed for a 20th-century, one-directional grid that do not reflect the realities of bi-directional power flows and distributed resources. As illustrated below, California’s energy planning process remains segmented across agencies and planning silos rather than integrated around minimizing system cost and maximizing net system value.
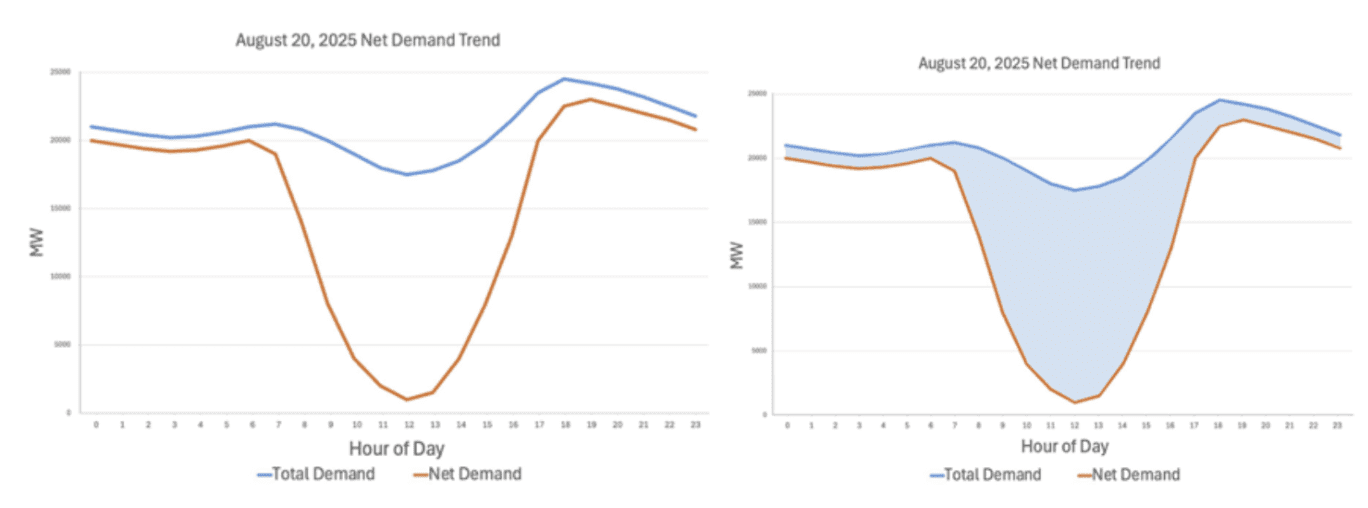
Total vs Net Demand: The Energy Tetris Objective
These graphs illustrate the two outcomes California must achieve simultaneously: decarbonization and affordability. Total demand (blue) represents all metered demand in the CAISO balancing area. Net demand (brown) is the remaining demand after CAISO-metered wind and solar are subtracted. The gap between total and net demand shows the extent to which variable renewables reduce system needs during the middle of the day, while the net-demand ramps highlight when flexible, dispatchable resources are needed. The remaining demand represented by net demand is currently served by nuclear, natural gas, energy storage, and other dispatchable resources—underscoring when additional clean, dispatchable supply is needed to meet 100% of demand.
Affordability, however, is driven by the infrastructure required to serve peak total demand. Bulk renewables rely on transmission infrastructure for delivery; even as these renewable resources reduce net demand, the grid still must be sized to deliver energy during peak conditions. Lowering the total-demand line through DER—especially targeted, distribution-sited deployments that place generation near matching load—is therefore essential to limiting incremental transmission and distribution buildouts and reducing long-term ratepayer costs.
Three Structural Flaws That Limit DER and Increase Grid Costs
The red “X” highlights the first of three critical flaws — distribution planning remains siloed from Integrated Resource Planning (IRP) and the Transmission Planning Process (TPP). When portfolio and transmission decisions are made without integrating distribution-level solutions, local reliability needs are often addressed through infrastructure expansion rather than targeted resource deployment. SCE’s Alberhill transmission project illustrates this dynamic. First proposed in 2009, the $165 million (or more) upgrade is driven in part by the need to serve 7 MW of load within a local reliability area that cannot be supported by the existing 115 kV line. Instead of deploying FOM distributed assets that could be planned, permitted, constructed, and interconnected within five years, the utility has spent 17 years navigating permitting and environmental review for a transmission solution. A final CPUC decision has yet to be issued.
Addressing this issue at the system level requires eliminating the silo between distribution and resource planning through integrated grid planning. In practice, that means prioritizing use of the existing grid and minimizing incremental infrastructure costs to the greatest extent possible.
The second issue is the inability to identify specific grid locations where strategic resource deployment can minimize infrastructure costs and maximize ratepayer value. The existing IRP (and TPP) are largely location-agnostic, optimizing portfolios at the zonal level without tying resources to specific substations or feeders. As a result, hyperlocal constraints are not considered until the distribution planning process, by which time it is too late to make the most impactful and cost-effective investments capable of addressing energy and grid needs. In the case of Alberhill, resolving the local reliability constraint would require a targeted deployment of at least 7 MW within the reliability area—an outcome that current planning processes are not structured to produce.
The third, and most fundamental issue, is the structural exclusion of DER,[1] especially FOM DER, from scenario planning in the IRP or SB 100 reports. In the IRP, the CPUC uses a capacity expansion model called RESOLVE, to select a least-cost energy portfolio. Because RESOLVE operates at a zonal transmission level and does not include a distribution planning component, FOM DER are not explicitly modeled as candidate resources. The result is an optimization that minimizes system generation costs at the transmission interface, while distribution-level constraints and infrastructure costs remain outside the objective function.
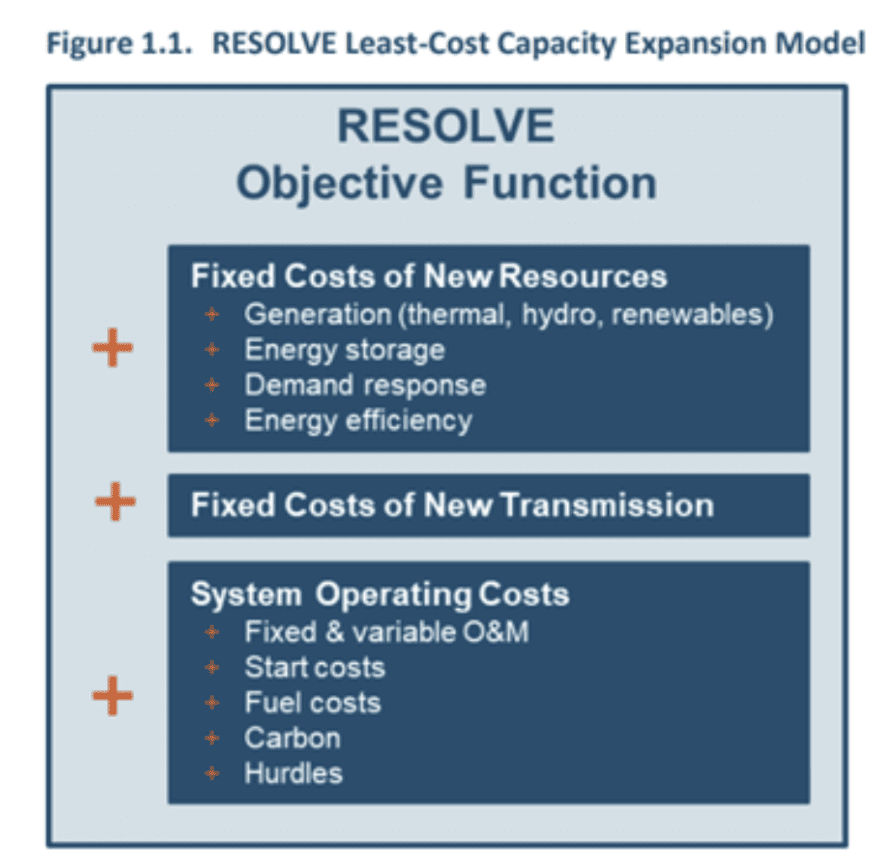
Description of RESOLVE by E3 (2019)
While RESOLVE is effective at optimizing generation portfolios within its defined parameters, those parameters do not capture many of the factors that ultimately drive costs and impacts for Californians. For example, RESOLVE incorporates high-level supply curve screens for land availability but does not optimize for distribution-level deliverability costs, feeder-level reliability and power quality,[2] resilience value, environmental justice constraints, fossil fuel plant retirement, permitting risk, interconnection timelines, or parcel-level land use conflict. California’s exceptionally high electric bills, with a large and growing share attributable to T&D costs, underscore the conclusion: optimizing generation cost at the transmission interface is not the same as minimizing total system cost.
Unlike the CPUC’s IRP, the CEC’s SB 100 modeling framework does allow FOM DER to be included as candidate resources. However, FOM DER have not been selected in any of the SB 100 least-cost portfolios, including the most recent study results released in February 2026. In practice, because FOM DER are not modeled with their full locational and distribution value and are treated like utility-scale supply, they remain structurally disadvantaged in the optimization results, even when technically available as candidates.[3]
California’s energy planning must evolve to reflect policy priorities that extend beyond simply minimizing generation costs and meeting renewable energy goals. The legacy portfolio structure, where generation portfolios are optimized first and infrastructure is designed afterward, no longer minimizes total system cost in a grid increasingly defined by bi-directional power flows and distributed resources. Integrated grid planning requires a co-optimized loop that evaluates generation, transmission, and distribution investments together while internalizing infrastructure costs within portfolio decisions and allowing distributed resources to compete directly with conventional “wires” solutions. Only through this iterative feedback process can California minimize total incremental infrastructure while meeting reliability, affordability, resilience, and environmental goals.
What does true Integrated Grid Planning look like?
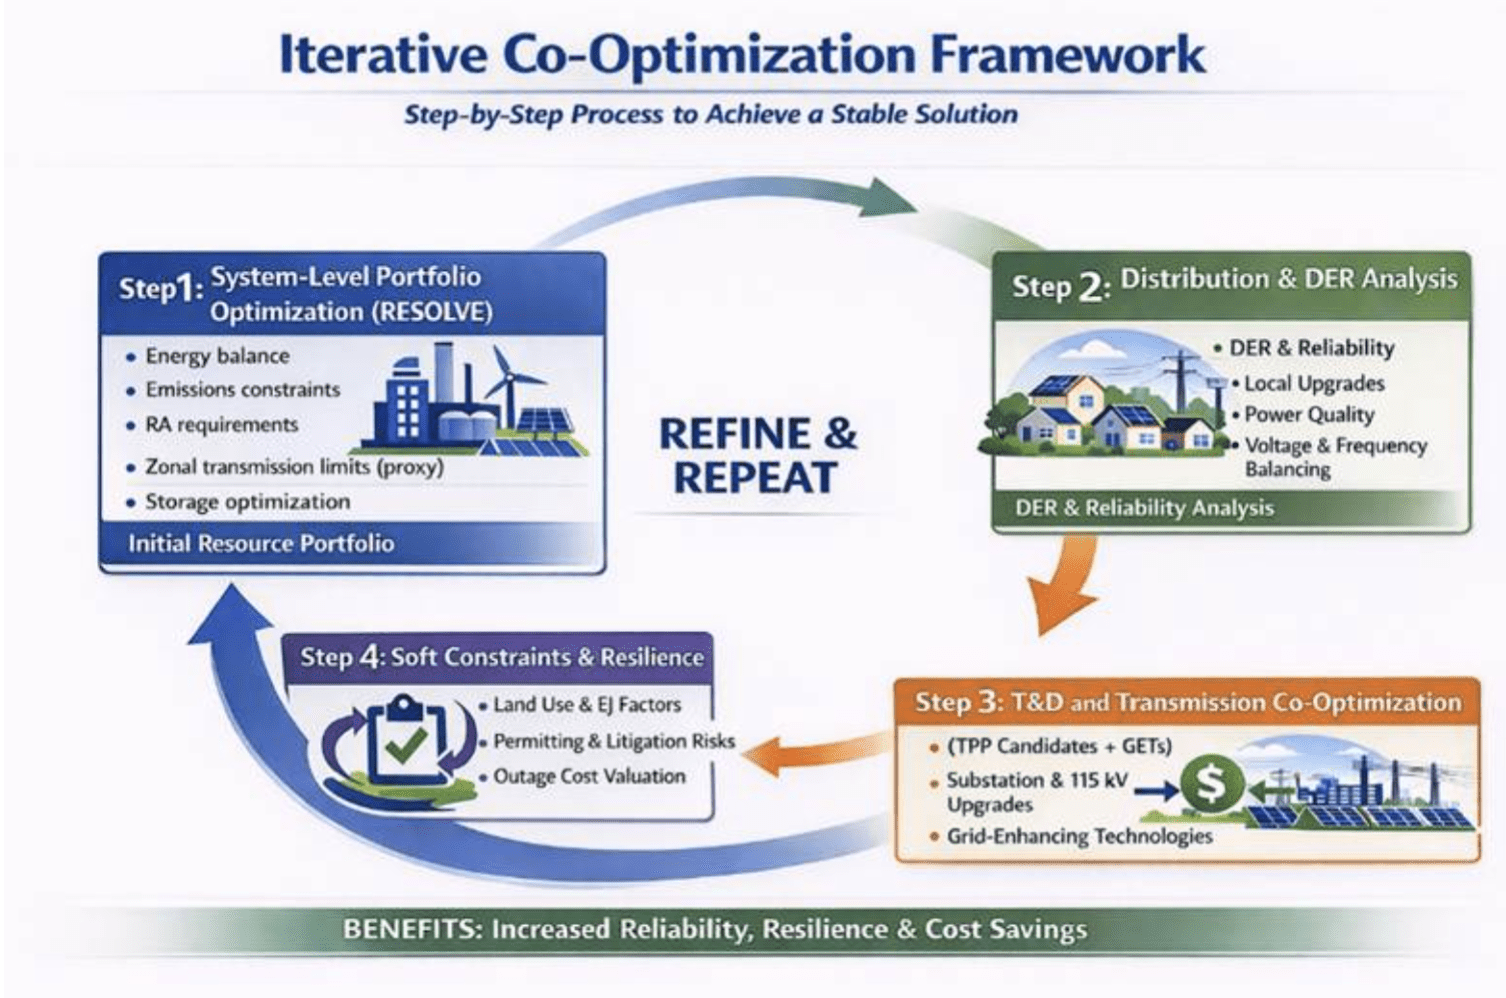
High-level logic of the iterative co-optimization loop (how outputs feed back to refine the portfolio) in Integrated Grid Planning
Integrated Grid Planning minimizes total system cost including incremental transmission, distribution, land-use externalities, siting risk, and reliability value — while meeting decarbonization and resilience targets. One option would be to build a new energy planning process from scratch, though that approach is neither efficient nor likely. A more pragmatic path is retooling the existing processes by incorporating new planning objectives and shifting away from a least-cost best fit framework to one that aims to maximize net system value. Fully integrating grid planning is not necessarily a new concept, more of a theory than a well-tested practice. Clean Coalition is not aware of any jurisdiction with a fully integrated planning process that encompasses generation, transmission, and distribution. Therefore, the remainder of this article will detail a possible structure designed to work in California and a phased implementation process. Despite the need to act swiftly, it is important to acknowledge that an immediate transition is unlikely.
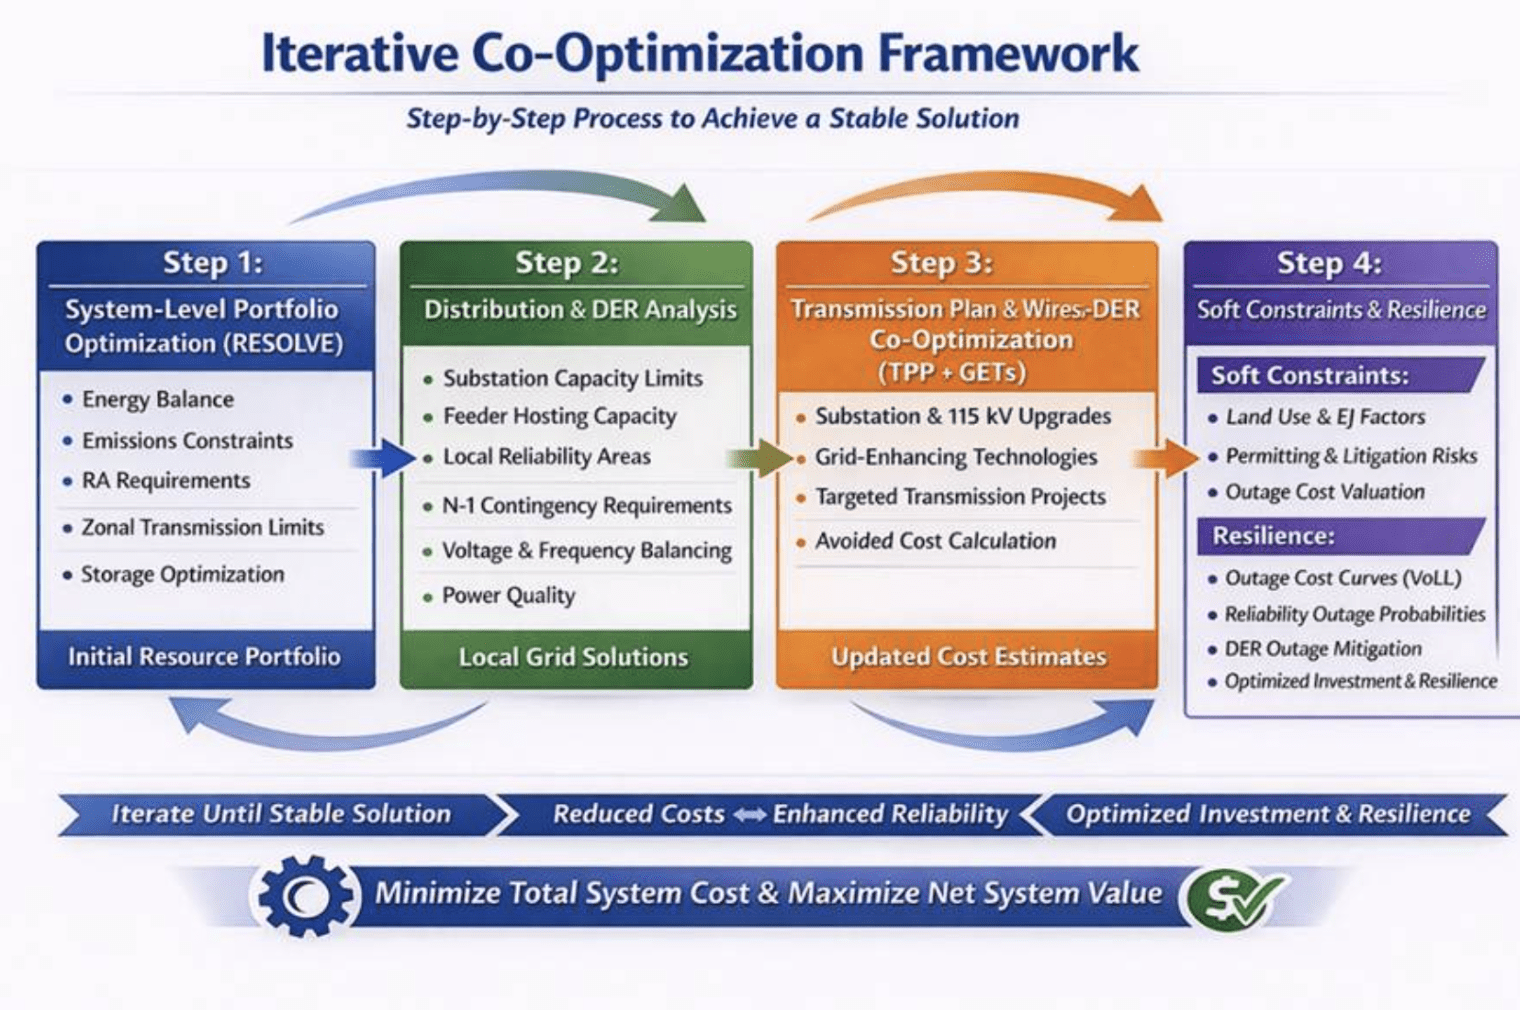
Proposed decision-grade outputs at each step of the co-optimization framework (what gets modeled and compared)
The existing planning framework is structured as a linear, step-by-step process, even though costs accumulate in nonlinear ways. Least-cost solutions selected during the initial portfolio phase can result in far higher total costs once transmission upgrades, distribution constraints, and deliverability risks are accounted for—and can produce limited net system value. The result is often a portfolio that is out of sync with true system needs. By contrast, Integrated Grid Planning is an iterative co-optimization framework: each step can be run multiple times to incorporate feedback from subsequent steps, allowing the final portfolio to converge on a stable solution that accurately reflects total system cost and maximizes ratepayer benefits.
Step 1: System-Level Portfolio Optimization (RESOLVE)
This step begins with the same foundational inputs used today—CEC demand forecasts and resource assumptions, and CARB emissions trajectories—which enables the CPUC to run the RESOLVE capacity-expansion model and select an initial least-cost energy portfolio that meets policy and reliability constraints. Under the co-optimization framework, Step 1 also incorporates locational feedback from later steps (e.g., constrained nodes, hosting capacity bands, and deferral values) so the portfolio reflects both system needs and distribution realities. A key near-term improvement is explicitly optimizing storage siting and dispatch assumptions to reduce total system cost and improve grid operability.
Step 1 Outputs: initial portfolio + zonal constraints/adders
Step 2: Distribution & DER Analysis
The state already has a distribution planning process—overseen by the CPUC and implemented primarily by the investor-owned utilities—that includes a grid needs assessment, a distribution resource plan, and hosting capacity tools. As currently structured, these are siloed from the rest of the planning processes and lack of granularity limits the ability to proactively address constrained areas, contributing to interconnection delays and the broader energization backlog that challenge California’s ability to electrify critical end uses and meet key housing and economic goals.
Under the co-optimization framework distribution planning occurs earlier to identify constrained locations where targeted deployments can increase utilization of existing infrastructure, relieve congestion at the substation level, or improve reliability and power quality. These outcomes reduce costs and create local co-benefits that cannot be captured through current system-level modeling.
Once this distribution and DER analysis occurs, the iterative loop feeds the results (e.g., constrained nodes, hosting capacity bands, upgrade deferral values, lead-time risk) back to Step 1, where RESOLVE can be rerun to include these new inputs. The revised portfolio selected can then minimize total system costs while maximizing net system value across generation and distribution constraints. This loop can be repeated until a stable solution emerges, with iteration rounds defined in advance to keep the planning schedule predictable.
Step 2 Outputs: constrained nodes + deferral value + lead-time risk
What needs to change to implement this:
- A requirement to produce standardized, decision-grade outputs that can feed back into Step 1 (and Step 3), and
- A formal mechanism to “elevate” constrained areas into portfolio-relevant constraints (not just distribution filings).
Step 3: Transmission Plan & Wires-vs-DER Co-Optimization (TPP+GETs)
The RESOLVE run in Step 1 can represent transmission only at a proxy level (e.g., zonal transfer constraints and generic cost adders). It does not substitute for CAISO’s Transmission Planning Process (TPP), which identifies specific transmission upgrades needed to reliably deliver a proposed portfolio and estimates the cost and timing of those upgrades. Step 3 is where those portfolio-driven transmission needs are evaluated through the TPP, explicitly including grid-enhancing technologies (GETs) and targeted, least-regrets upgrades as alternatives to traditional buildouts.[4]
Because CAISO has sole jurisdiction over the TPP, the CPUC does not run this step. However, the CPUC can ensure the portfolio and study assumptions provided into the TPP reflect policy priorities and distribution-level realities defined in Step 2 (for example, higher penetrations of local DER, distribution-sited storage, managed charging, and GETs that reduce congestion and defer upgrades). The key deliverable from Step 3 is a set of candidate transmission/GET solutions—with cost ranges, lead-time risk, and locational constraints—that can be compared directly against local DER and distribution upgrade alternatives.
With these results in hand, the CPUC (and parties) can perform an avoided cost/comparative portfolio test to determine whether a transmission candidate is essential, deferrable, or better addressed through targeted local procurement. For example, the CPUC analysis may say:
- “avoid this upgrade if X MW DER is procured here”
- or “proceed with this transmission candidate, DER doesn’t pencil out here”
- or feed updated cost adders and locational constraints back into Step 1.
This step can iterate back to Step 1 for an updated portfolio (analogous to the refinement from a Reference System Plan to a Preferred System Plan) or proceed to Step 4 to apply resilience valuation and other policy-relevant risk adjustments before finalizing a stable solution.
Step 3 Outputs: transmission/GET candidate set + cost/timing ranges + constraints
What needs to change to implement this?
- A standardized “TPP-to-IRP interface” that produces decision-grade outputs the CPUC can use (candidate solutions, cost and lead-time ranges, constraint location, and whether each solution is essential vs deferrable).
- A formal requirement to evaluate non-wires and GET alternatives alongside traditional transmission upgrades for the same constraint (making “wires vs DER vs GETs” an explicit comparison, not an afterthought).
- A defined iteration trigger and calendar (e.g., if Step 3 identifies a major upgrade cost driver, feed the updated transmission adders/locational constraints back to Step 1 for one additional RESOLVE run).
- Scenario alignment so the TPP studies reflect the Step 1/Step 2 portfolio and local resource assumptions (DER, managed charging, distribution-sited storage) rather than default assumptions that ignore them.
Step 4: Risk, Externality, and Resilience (Policy-Consistent Adjustments)
Step 4 is the greatest departure from the normal planning process because it incorporates risk and non-energy impacts that routinely affect Californians but are largely excluded from core portfolio optimization. Rather than relying on subjective scoring, these factors should be translated into risk-adjusted cost multipliers, constraints, or scenario sensitivities so they can be applied transparently and consistently across competing solutions.
- Land use and ecological impact: Apply siting-intensity and habitat-sensitivity multipliers to greenfield development and new corridor-dependent transmission, while explicitly valuing built-environment and previously disturbed sites that reduce land conversion and permitting exposure.
- Environmental justice (EJ) and local air-quality exposure: Incorporate localized pollution exposure and health-risk considerations by applying EJ siting penalties and by valuing portfolios that reduce reliance on fossil fuel peaker plants in disadvantaged and vulnerable communities through local clean capacity and demand flexibility.
- Permitting and delivery risk (“can it actually be built?”): Adjust portfolio costs and feasibility based on expected lead times, interconnection queue attrition, and litigation/permitting delay probability—including delay-related financing costs (interest during construction)—so portfolios are optimized not only for modeled performance but also for realistic deployability.
- Resilience value: Quantify the value of reducing outages by assigning outage cost curves (VoLL), reliability-area outage probabilities, and allowing DER and microgrid-capable deployments to reduce expected outage costs. Monetize avoided outage losses as a system benefit that can shift resource selection in constrained areas.
Planning should not only be optimized for “least cost” on a spreadsheet, but also based on viability in the real world, including permitting timelines, interconnection risk, and the probability that resources will actually come online when needed.
Step 4 Outputs: risk-adjusted cost multipliers and policy constraints (land/EJ/permitting/interconnection), quantified resilience benefits (VoLL-based avoided outage losses), and an updated risk-adjusted comparison that either validates a stable portfolio or triggers another iteration back to Step 1.
What needs to change to implement this?
- Implementation must treat these components as risk-adjusted cost multipliers or scenario sensitivities, not just subjective scoring.
The remaining question is implementation: aligning timelines, standardizing decision-grade outputs, and establishing a clearly governed handoff between the CPUC, CAISO, and utility distribution planning.
Implementing Integrated Grid Planning in California
Two bottlenecks must be addressed to effectively implement integrated grid planning: timing alignment and decision-grade data interfaces. First, IRP cycles, CAISO’s TPP, and distribution planning do not align neatly, so iteration cannot be open-ended. A feasible solution is a two-iteration cap per cycle under a firm calendar:
– Iteration A develops a baseline portfolio, identifies constrained distribution areas, and compares candidate wires/GETs and DER alternatives.
– Iteration B reruns the portfolio with updated locational adders and constraints to produce final PSP outputs.
Second, distribution-level data is often proprietary and inconsistent across utilities, which makes it difficult to integrate directly into a system-level modeling process. The solution is not to publish raw data, but to require standardized decision-grade outputs that allow planning entities to exchange comparable inputs while protecting confidentiality. For example, hosting capacity ranges by constrained node, upgrade cost estimates with uncertainty, lead-time risk assumptions, and DER procurement parameters can provide a common interface for iterative planning. Quality data need not compromise confidentiality. With these guardrails in place, California can implement the framework through a phased approach.
- Pilot Phase: Apply the planning loop to a small set of constrained areas (e.g., local reliability pockets or substations with known upgrade drivers). Use proxy transmission constraints in Step 1, incorporate CAISO TPP candidate solution summaries (including GETs) in Step 3, and run a single iteration.
- Scaling Phase: Expand the set of constrained areas, standardize DER-versus-wires comparisons statewide, and integrate GETs consistently as an alternative class.
- Institutionalize Results Phase: Embed the calendar and interfaces into routine planning cycles and apply more rigorous resilience valuation and risk multipliers. Note, the end goal is not a single “mega-model” that solves power flow, distribution constraints, procurement, and permitting/EJ/resilience simultaneously in one run. Rather, the most realistic goal is a governed co-optimization loop that connects existing authorities through standardized handoffs and a regular cadence of model improvement and updates.
Implemented in this way, integrated grid planning does not require a complete rewriting of California’s institutional framework or even replacing existing tools. Instead, it requires a disciplined interface between them: a fixed iteration calendar, standardized decision-grade data and outputs, and a transparent process that forces local DER, grid-enhancing technologies, and wires upgrades to compete on the same cost-and-value basis. When transmission, distribution constraints, and deployment risk are incorporated before procurement decisions are finalized, the result is an integrated planning workflow that preserves jurisdictional boundaries while producing portfolios that are both least-cost in theory and deliverable in practice.
Conclusion
California cannot solve an affordability crisis by continuing to optimize only generation while infrastructure costs grow unchecked. Energy Tetris is the recognition that the grid is a single board: generation, transmission, and distribution decisions must be fitted together, iteratively, so every piece competes on the basis of total system cost and net system value. By enabling DER, GETs, and wires solutions to be compared transparently and deployed where they create the greatest system benefit, integrated grid planning can reduce total demand on expensive infrastructure while driving net demand toward zero-carbon supply. The outcome is not just a cleaner grid, but a more affordable and resilient one—built by finally using all the available pieces.
[1] BTM DER are an input in RESOLVE—as a load modifier—not a resource class that can be selected by the model.
[2] Reliability is not considered on a more granular basis than CAISO Local Reliability areas.
[3] The CEC has begun incorporating certain non-energy impact considerations into SB 100 modeling, representing incremental progress toward broader system evaluation. However, these adjustments have not materially altered portfolio outcomes with respect to FOM DER selection.
[4] If transmission planning shifts to a broader regional framework over time, Step 3 would use that process as the transmission-planning input layer in place of, or in coordination with, CAISO’s TPP.