Fresh Pac Solar Microgrid Feasibility Study
The Clean Coalition produced a Solar Microgrid Feasibility Study showcasing the resilience and economic benefits to Fresh Pac.
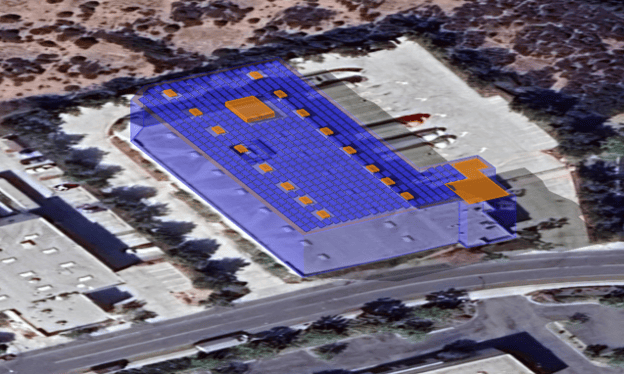
Figure 1: Preliminary three-dimensional visualization of the rooftop solar layout at Fresh Pac
The Clean Coalition completed a Solar Microgrid Feasibility Study for Fresh Pac’s facility at 1476 Corporate Center Drive in San Diego. The analysis shows how onsite solar, battery storage, and planned electric vehicle (EV) charging could work together to reduce electricity costs, expand the use of clean local energy, and provide resilience during grid outages.
The study focused on the site’s main meter and evaluated a 282-kilowatt-direct-current (kWdc) rooftop solar photovoltaic (PV) system paired with a 300-kilowatt (kW), 611-kilowatt-hour (kWh) Battery Energy Storage System (BESS) with microgrid capabilities. Under the modeled cash-purchase case, the proposed system produces nearly $5.95 million in net cumulative savings over 25 years, before accounting for an additional $2.88 million in value of resilience.
The resilience modeling also indicates that the Solar Microgrid could support 52% of the facility’s existing Baseline Load Profile (BLP) indefinitely and 25% of the projected Master Load Profile (MLP) indefinitely. These results exceed Fresh Pac’s initial request for the Solar Microgrid to support 35% of the BLP indefinitely.
Project scope and deliverables
The project’s objective was to assess the technical and economic feasibility of a Solar Microgrid at Fresh Pac’s San Diego facility. The analysis incorporated 2024 interval load data, projected EV charging, rooftop solar siting, battery sizing, utility bill savings, and the economic value of resilience.
The feasibility study followed the Clean Coalition’s Solar Microgrid Methodology (SMM), which organizes the work into five connected steps:
- Load profiles. Establish the historical load, model anticipated changes, and define the loads that must be supported during grid outages.
- Resource scenarios. Evaluate technically viable solar and storage combinations that advance economic, environmental, and resilience objectives.
- Site layouts. Identify recommended locations for solar, storage, EV charging, the utility meter, and other key electrical assets.
- Economic analyses. Estimate project costs, incentives, utility bill savings, operations and maintenance costs, and value of resilience.
- Reporting and recommendations. Summarize the findings and identify the most practical path toward implementation.
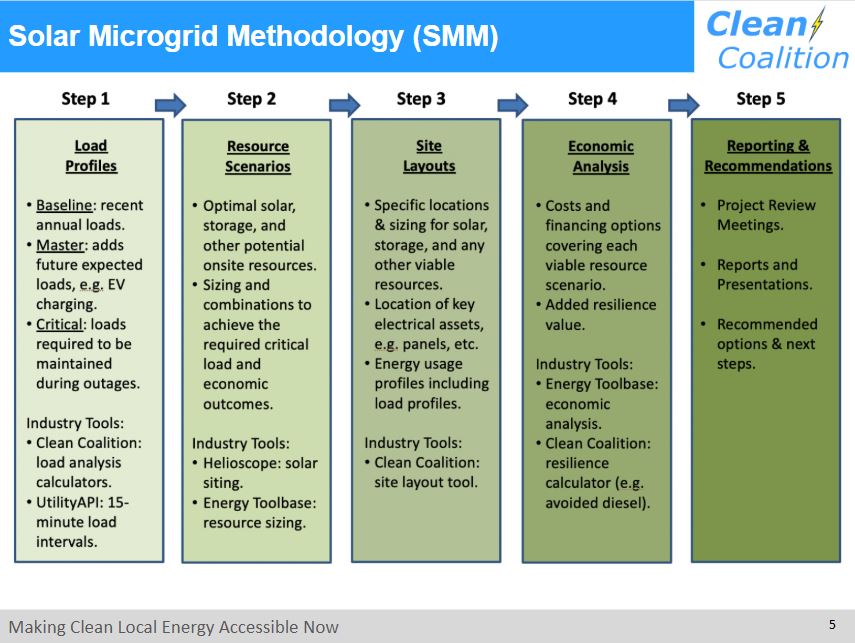
Figure 2: The Clean Coalition’s five-step Solar Microgrid Methodology
Step 1: Load profiles
The BLP was developed from calendar-year 2024 interval data downloaded through UtilityAPI and cleaned by the Clean Coalition. The BLP totals 276,494 kWh per year and has a peak demand of 120 kW.
The Adjustments Load Profile (ALP) models planned EV charging infrastructure. The modeled charging includes one Level 3 port rated at 100 kW and four Level 2 ports rated at 10 kW each. The Level 3 port was modeled at a 50-kW charging rate from 6 a.m. to 6 p.m. each day. The four Level 2 ports follow the Clean Coalition’s employee and public charging profile, peaking during the morning and reducing their combined charging rate to 4 kW from 4 p.m. to 9 p.m. to limit usage during the most expensive time-of-use period.
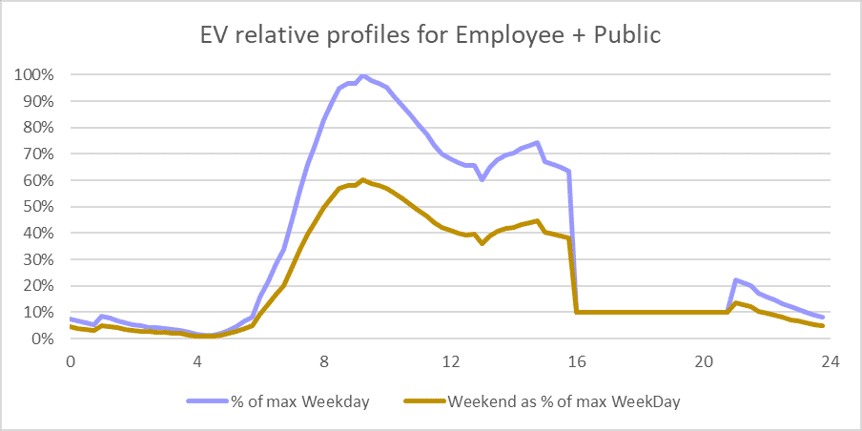
Figure 3: Relative weekday and weekend Employee and Public EV charging profiles used in the study
The ALP contributes 319,254 kWh annually. When the BLP and ALP are combined at each 15-minute interval, the resulting MLP totals 595,748 kWh per year and reaches a peak demand of 260 kW.
For resilience planning, Fresh Pac initially requested that the Solar Microgrid support 35% of the BLP indefinitely. This target corresponds to 96,773 kWh annually and a 42-kW peak.

Figure 4: Annual energy and peak demand for the BLP, ALP, MLP, and Fresh Pac’s initial 35% resilience target
Step 2: Resource scenarios
The rooftop siting assessment identified capacity for a 282-kWdc solar system. The recommended configuration includes 478 Qcells 590-watt modules mounted in landscape orientation on fixed-tilt racking at a 15-degree tilt and a 180-degree azimuth. Four SMA Sunny Tripower CORE1 inverters provide 250 kW of alternating-current capacity, and Tigo Energy optimizers are included in the modeled design.
The solar siting summary estimates 526,336 kWh of generation in Year 1, equivalent to approximately 88% of annual MLP energy use. The analysis assumes 0.5% annual solar degradation, resulting in modeled annual generation of approximately 490,666 kWh by Year 15.
The recommended BESS is rated at 300 kW and 611 kWh in Year 1. The resilience analysis assumes 2% annual battery degradation and models 460 kWh of available battery energy in Year 15.
Step 3: Site layout and resilience
The site layout places the solar array across the facility’s main roof and identifies the primary meter, potential BESS locations, and planned EV charging infrastructure. The layout provides a practical starting point for detailed electrical design, structural review, fire-access planning, equipment siting, and interconnection work.
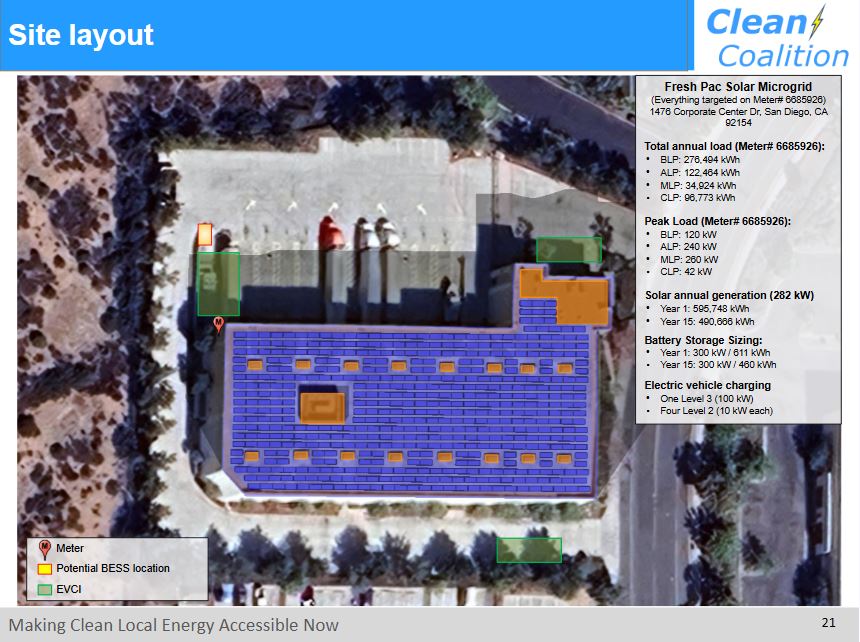
Figure 5: Preliminary site layout of the 282-kW rooftop solar system, BESS, and EV charging
To evaluate resilience, the study calculates the maximum daily Total Critical Load Required (TCLR) by subtracting average daily solar generation in the applicable month from the maximum daily electricity requirement. This method estimates the largest daily energy deficit that the battery must cover in a worst-case period.
At Year 15, after the assumed solar and battery degradation, the maximum daily TCLR is 14 kWh for the BLP and 962 kWh for the MLP. With 460 kWh of modeled Year 15 battery energy, this translates to approximately 32 days of BLP resilience and 11 hours of MLP resilience under the study’s worst-case calculation. Average resilience durations are expected to be longer than these worst-case results.
The model also estimates indefinite renewables-driven resilience for 52% of the BLP and 25% of the MLP. These results exceed Fresh Pac’s initial target of supporting 35% of the BLP indefinitely. The recommended system size was selected because it produced the strongest economic performance among the modeled solar-and-BESS combinations, with the higher indefinite-resilience percentages emerging from that economically preferred configuration.

Figure 6: Battery power and energy capacity used in the Year 1 and Year 15 resilience analysis
Step 4: Economic analysis
The economic analysis evaluates a cash-purchase case over 25 years. The model assumes a solar cost of $3.50 per watt and a BESS cost of $1,500 per kWh, producing a gross project cost of $1,903,570. Modeled incentives and tax benefits total $1,208,767, including a 30% Investment Tax Credit (ITC), federal Modified Accelerated Cost Recovery System (MACRS) and bonus depreciation benefits, and state MACRS benefits. After these modeled benefits, the net project cost is $694,803.

Figure 7: Modeled gross project cost, tax benefits, and net project cost
Cash-purchase cash flow
The 25-year cash-flow analysis tracks upfront project costs, operations and maintenance (O&M) costs, equipment replacement costs, electricity bill savings, solar generation, tax effects, annual cash flow, and cumulative cash flow. Under the study’s assumptions, the model produces a 4.3-year payback, a 312.4% return on investment (ROI), a 15.1% 10-year internal rate of return (IRR), and a 19.2% 20-year IRR. The analysis also includes a $351,990 equipment-replacement cost in Year 16.
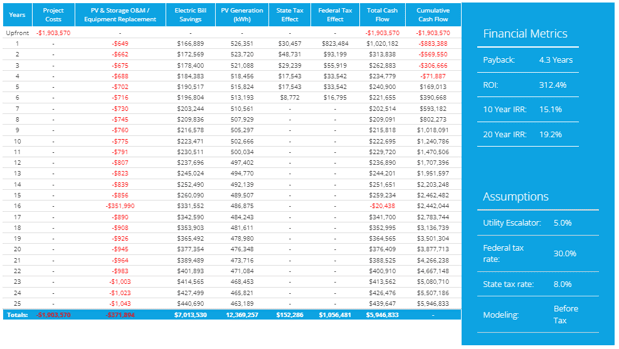
Figure 8: Twenty-five-year cash flow for the modeled cash-purchase case
The MLP’s modeled Year 1 utility bill is $241,637 before the Solar Microgrid and $74,748 after it, yielding $166,889 in first-year savings. Over 25 years, the analysis estimates $7,013,530 in electricity bill savings. After the $694,803 net project cost and $371,894 in total O&M costs, net cumulative savings reach $5,946,833.
Year 1 utility bill savings

Figure 9: Modeled Year 1 utility bill before and after the Solar Microgrid under the MLP
These results reflect the study’s assumptions, including a 5% annual utility cost escalator, San Diego Gas & Electric’s AL-TOU-Commercial rate schedule, and San Diego Community Power’s Power On service. Current rates, equipment costs, incentives, and tax treatment should be confirmed before Fresh Pac proceeds to procurement.
Value-of-Resilience (VOR)
Electricity bill savings capture only part of the project’s value. The Clean Coalition’s VOR methodology, known as VOR123, assigns an additional economic value when a Solar Microgrid can maintain meaningful portions of a site’s load during grid outages.
Because the model indicates that 25% of Fresh Pac’s MLP can be maintained indefinitely, the study applies a 25% value-of-resilience (VOR) adder to the modeled utility bill and escalates that value at 5% annually. This produces a 25-year VOR of $2,883,158. More information is available through the Clean Coalition’s VOR123 methodology.
Step 5: Reporting and recommendations
Key findings
- Recommended system: 282 kWdc of rooftop solar paired with a 300-kW/611-kWh BESS with microgrid capabilities.
- Renewable energy: The solar siting summary projects 526,336 kWh of Year 1 generation, equal to approximately 88% of annual MLP energy use.
- Economic value: Approximately $5.95 million in 25-year net cumulative savings under the modeled cash-purchase case.
- Resilience value: Approximately $2.88 million in additional 25-year value of resilience.
- Indefinite resilience: 52% of the BLP and 25% of the MLP can be maintained indefinitely under the model.
- Resilience target: The modeled system exceeds Fresh Pac’s initial goal of maintaining 35% of the BLP indefinitely.
Recommendations and next steps
Based on the study’s findings, the Clean Coalition recommends moving forward with development of a Solar Microgrid at Freshpac. The proposed project offers a compelling combination of economic, environmental, and resilience benefits.
The next phase should validate the roof and electrical design, refine BESS and EV charging locations, update utility rates and incentive assumptions, and initiate the procurement, permitting, and interconnection processes. These steps will convert the feasibility study into an implementation-ready project.