How to Generate Load Profiles Using ResStock and ComStock
This blog post by the Clean Coalition describes the process of using the commercial building model databases, ResStock and ComStock, to complete the Load Profiles portion of the Solar Microgrid Methodology (SMM).
How to Generate Load Profiles Using ResStock and ComStock
The Clean Coalition conducts Solar Microgrid Feasibility Studies to quantify the benefits of installing a Solar Microgrid at a particular site. The feasibility studies follow the Solar Microgrid Methodology (SMM). The residential and commercial building model databases ResStock and ComStock are useful for Step 1: Load Profiles of the SMM, highlighted below. 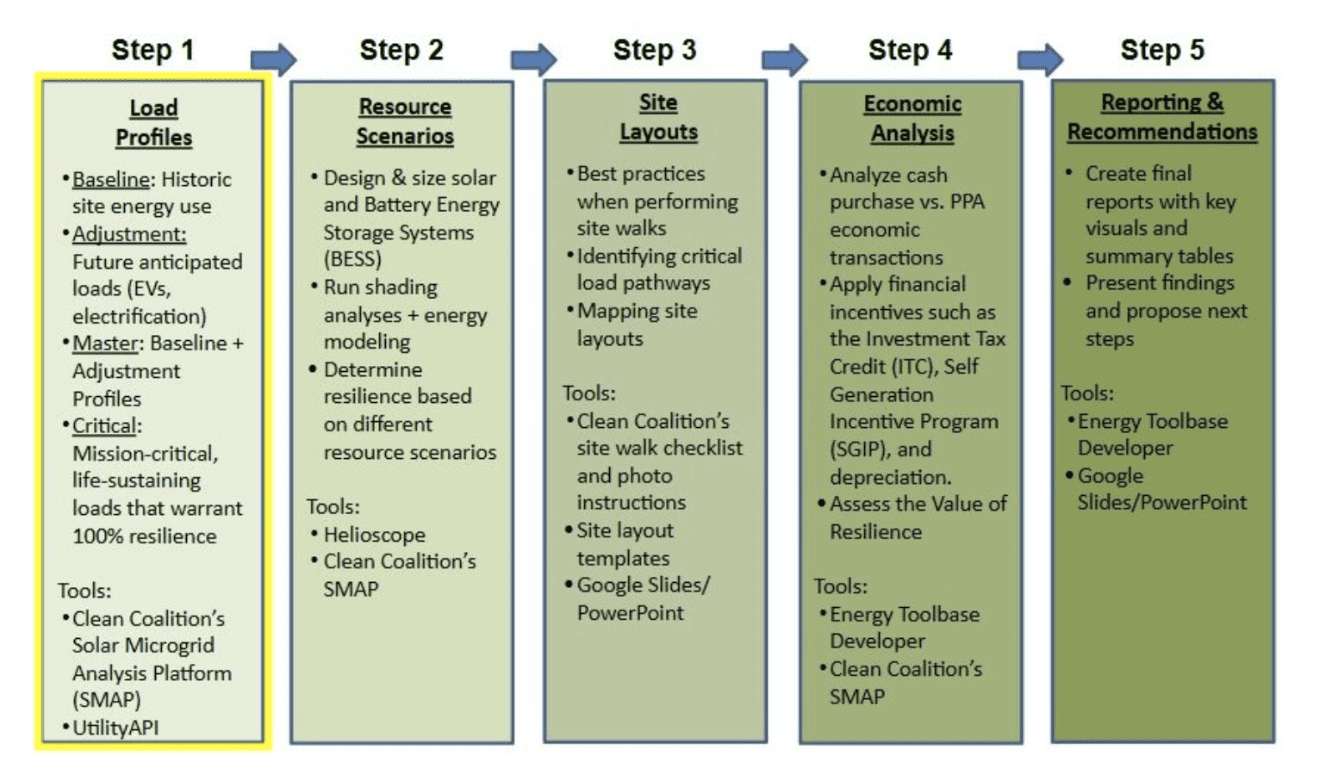
The five steps of the SMM.
The term load profile generally refers to the annual interval usage of electrical loads per site, with 15-minute and 1-hour intervals being typical. The Baseline Load Profile (BLP) is the historical annual usage of electrical loads per site. The Adjustments Load Profile (ALP) accounts for changes to this baseline load from anticipated EV Charging Infrastructure (EVCI), electrification, energy efficiency, and new facilities. The Master Load Profile (MLP) is used for the study’s analysis, created by summing the BLP and the ALP at each interval.
Accurate estimations of load profiles are crucial to designing an optimized Solar Microgrid. When choosing a solar system size, the annual solar generation of the system should equal or slightly exceed the total annual load to “net zero” the site. When choosing a Battery Energy Storage System (BESS) size, the battery’s power capacity must be larger than the peak load in order for a Solar Microgrid to serve the entire site load no matter when grid outages occur and for how long.. The peak load is derived from load profile analysis. By ensuring that a Solar Microgrid is appropriately sized for a site’s annual load and peak load, economic and resilience benefits are co-optimized.
Some sites have a history of consistent electricity usage data that reflects the BLP of the site, but new construction or a change in use for the site means historic electricity usage data is unavailable or would be inaccurate.
To supplement this data deficiency, the Clean Coalition utilizes ResStock and ComStock in place of historic site-specific electricity usage data. ResStock, developed by the National Laboratory of the Rockies (NLR, formerly known as NREL), models the entire U.S. residential building stock to simulate load profiles. Similarly, ComStock is a database that models load profiles for the U.S. commercial building stock.
Below is the general process of using ResStock and ComStock to simulate a load profile:
- Choose the “by state” data viewer link.
- Sign in or create a free account.
- Select the preferred state and any applicable filters. Examples of possible filters include square footage, location, and HVAC and water heating fuel types.
- Duplicate the tab showing the time series graph. In the second tab, toggle from the time series graph to the histogram.
- Export the time series data as a CSV file, choosing “15 minute resolution.” This is not the load profile, but an aggregation of the load profiles of all the buildings that meet the selected criteria.
- The histogram shows the total number of buildings that meet the selected criteria. In the CSV file, divide the column titled “baseline.out.electricity.total.energy_consumption.kwh” by the total number of buildings from the histogram.
- The resulting column is the generated BLP, ready for use. Check that the sum of the column is a similar value to the x-axis values of the histogram.
The wide variety of filters create opportunities for high specificity of energy usage, enabling generation of highly customized estimated load profiles.
ResStock application example: Seminole Springs Mobile Home
Seminole Springs is a mobile home park in Ventura County with over 200 mobile homes. Given a partial year historic load profile from one mobile home, comparison with other load profiles was necessary to judge whether the load profile was representative of other homes in the community.
Load profiles of low, medium, and high energy use of fully-electric mobile homes with additional specifications were simulated using ResStock. Upon comparison to the partial year data, the medium energy use load profile was selected for use as the BLP for the Seminole Springs Community Microgrid feasibility study, which evaluated a Community Microgrid comprised of numerous individual Solar Microgrids sited at each mobile home, with rooftop solar and residential-scale batteries.
The following filters were applied when simulating the load profiles:
- Geometry building type: Mobile home
- Electric vehicle charger: None
- Heating and water heater fuel: Electricity
- County name: Los Angeles County, Santa Barbara County, Ventura County
- Geometry floor area: 500-1499 sq ft
- Usage level: Low, medium, high
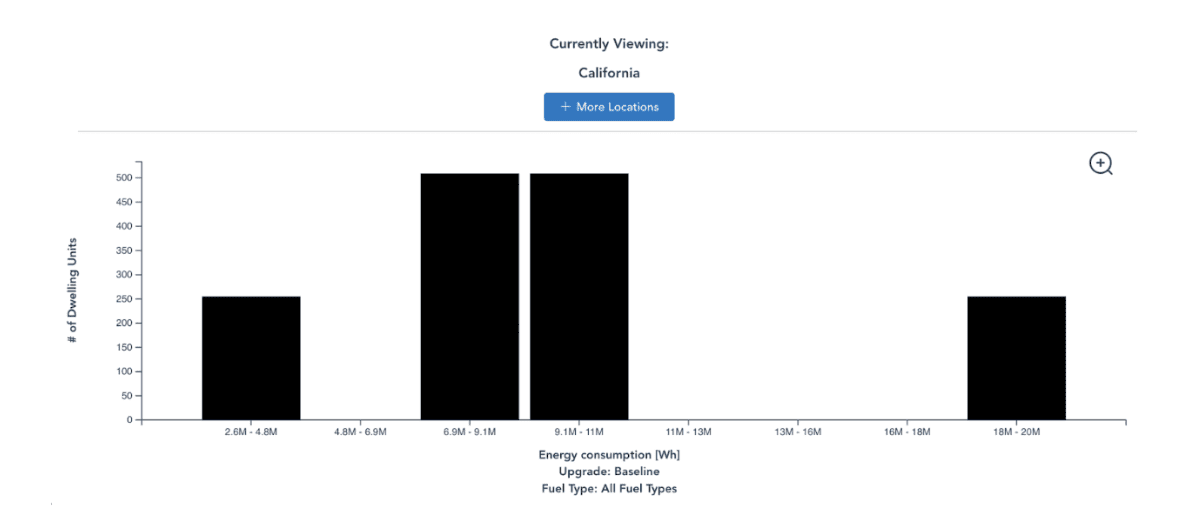
Histogram for the Seminole Springs BLP on ResStock showing the number of homes that match the filters, grouped by energy consumption range.
As more filters are applied, the sample size of homes that align with the specifications decreases, increasing the degree of approximation of the generated load profiles.
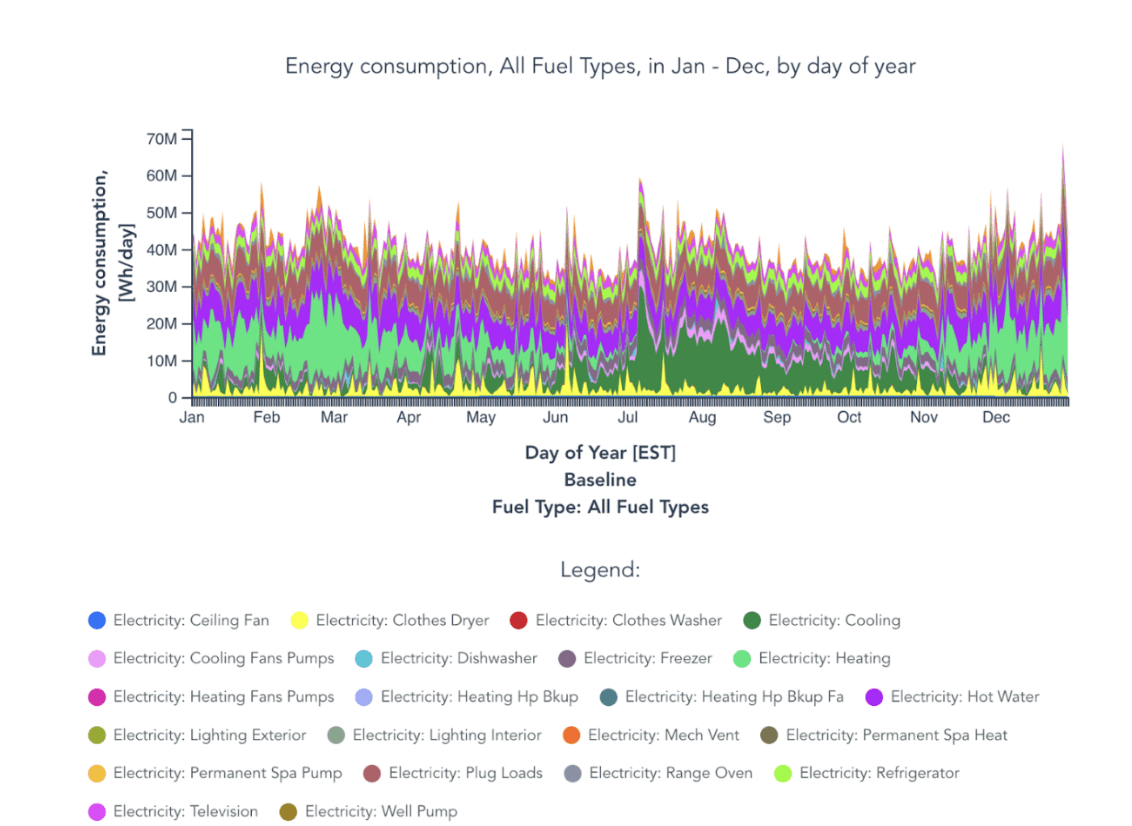
ResStock time series graph for a fully-electric mobile home with medium energy usage.
Continuing the general process of using ResStock yielded a BLP for a medium-use mobile home for the Solar Microgrid Feasibility Study for Seminole Springs.
ComStock application example: Ojai Valley Community Resilience Center (CRC)
Ojai Valley is in an isolated, grid-vulnerable area that is in the middle of extreme wildfire risk. These conditions make Ojai Valley a perfect candidate for a Solar Microgrid to provide renewables-driven resilience. Fire Safe Ojai was awarded a grant to build a Community Resilience Center (CRC) that is served by a Solar Microgrid. A former women’s detention center has been selected for the Ojai Valley CRC, and because the new use is completely different, a Baseline Load Profile (BLP) is not available. To estimate the BLP, ComStock was used, based on a small office building type in Ojai of a similar size. A small office was chosen to most closely model the CRC’s typical use.
The following filters were applied when simulating the load profile:
- Square footage: 21,000
- Heating and service water heating fuel: electricity
- ASHRAE ICC Climate Zone: 3B
- Comstock building type: Small office
- Electric vehicle charging not included
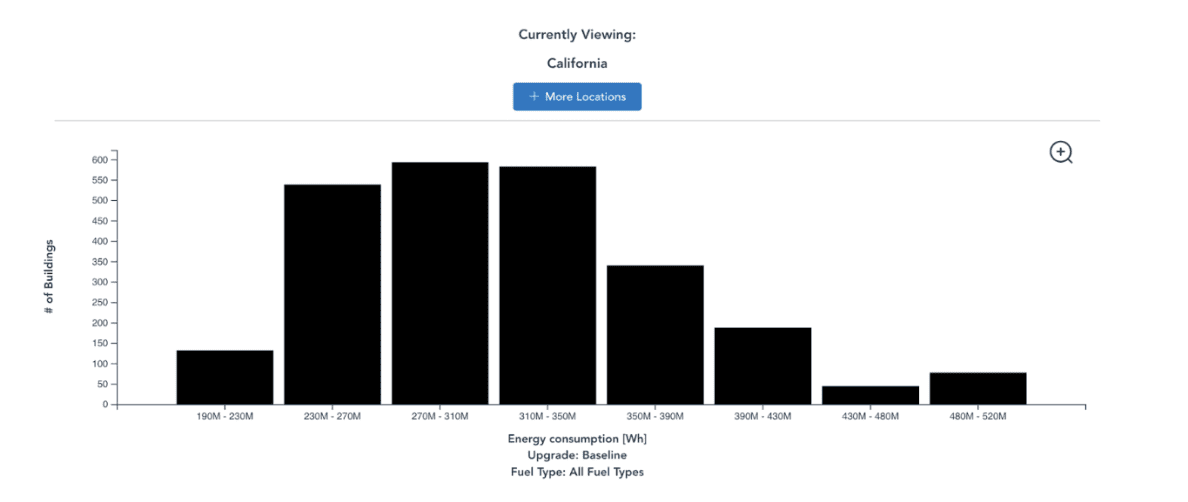
Histogram for the Ojai Valley CRC BLP on ComStock showing the number of buildings that match the filters, grouped by energy consumption range.
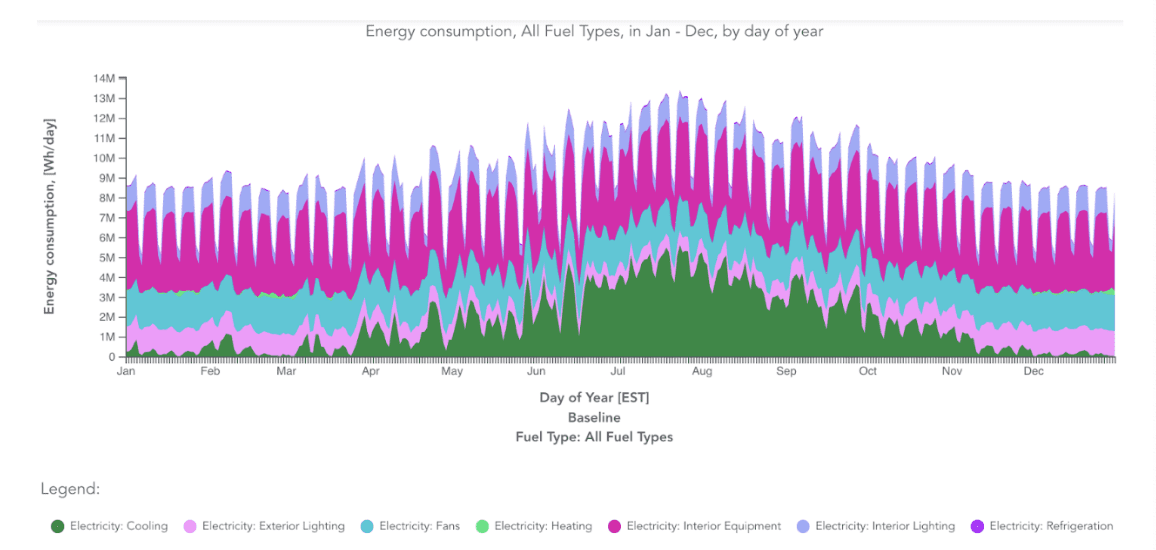
ComStock time series graph for a small office building.
The simulated BLP combined with an Adjustments Load Profile (ALP) for EV charging makes up the Master Load Profile (MLP) for the site. With a properly estimated MLP, appropriate solar and BESS sizes can be assessed for the site in the next step of the Solar Microgrid Methodology (SMM).
For both residential and commercial sites, the Clean Coalition generates load profile estimations using ResStock and ComStock. As a result, Solar Microgrid feasibility studies are able to more effectively co-optimize the economic and resilience benefits of solar-driven microgrids when historic load data is not available for a given site.