One Farm, Five Solar Microgrids – Brand Farms Solar Microgrid Feasibility Studies
The Clean Coalition produced a Solar Microgrids Feasibility Study showcasing five site-specific designs across Brand Farms, led by a DC-coupled Solar Microgrid that could enable 2.5 MWdc of new LED grow lighting.
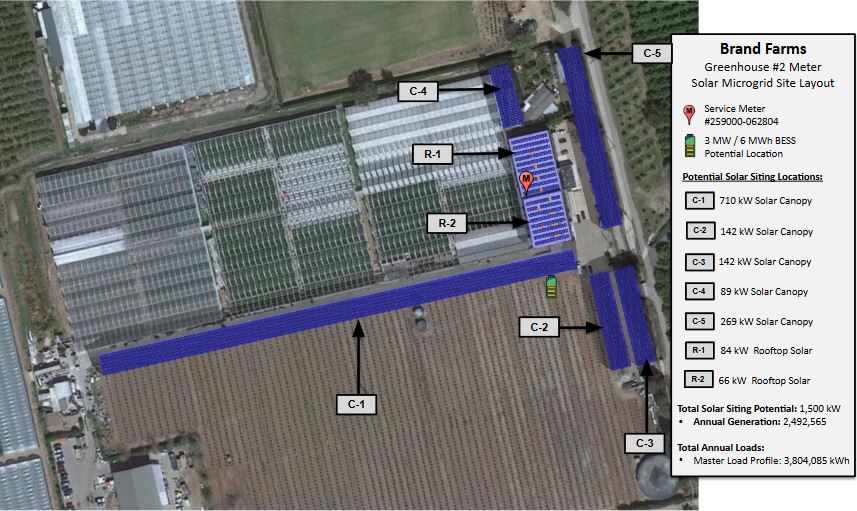
Figure 1. Proposed solar siting around Greenhouse 2, with canopy and rooftop locations distributed across the site.
Brand Farms is not one electrical problem. Its greenhouses, agricultural support buildings, and residences sit behind different meters, serve different loads, and offer different solar-siting opportunities. To reflect that reality, the Clean Coalition completed five Solar Microgrid Feasibility Studies (SMFS) — one for each of five load centers.
The centerpiece was Greenhouse Meter 2 (GH2), where Brand Farms wanted to add 2.5 megawatts direct current (MWdc) of light-emitting diode (LED) grow lighting. That seasonal load is many times larger than the meter’s existing alternating current (AC) demand, so the study did more than place solar on a map. It examined how a direct current (DC)-coupled Solar Microgrid could coordinate the new lighting, onsite generation, battery storage, the utility grid, and backup generation.

Four additional studies — for Greenhouse Meter 1 (GH1), the Red Barn Meter, the Ranch Meter, and the Main House Meter — completed the portfolio. Read together, the studies show why multi-meter properties need a family of site-specific designs rather than one standard microgrid repeated five times.
The headline study: Greenhouse Meter 2
Before the proposed LEDs, GH2 used 1,529,085 kilowatt-hours (kWh) annually and reached a 291-kilowatt (kW) peak. The study modeled the new 2.5-MWdc lighting load for four to six hours a day from October through March, increasing the go-forward Master Load Profile (MLP) to 3,804,085 kWh per year. The Southern California Edison (SCE) meter was shown with a 665-kW AC limit, making the proposed seasonal DC load the defining design issue.
A common DC bus changes the question
The proposed architecture places 1.5 MWdc of solar, a 3-MW / 6-megawatt-hour (MWh) battery energy storage system (BESS), and the 2.5-MWdc LED load around a common 800-volt DC bus. A 530-kW inverter connects that DC system to the existing 480-volt AC service. The concept also retains the grid connection and a diesel generator for the AC side of the facility.
This configuration lets locally generated solar and stored energy serve the LEDs on the DC side while the inverter manages exchange with the existing AC system. It turns the Solar Microgrid into enabling infrastructure for the lighting expansion rather than an add-on sized only to the historical electricity bill.
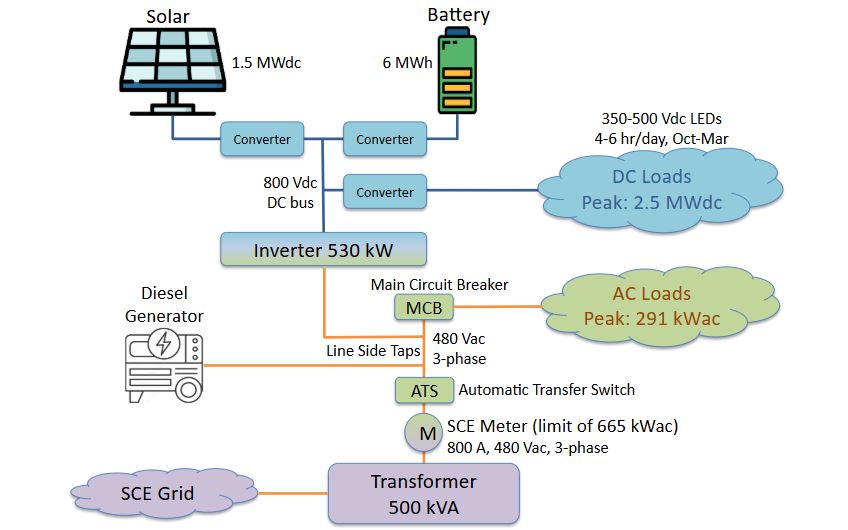
Figure 2. DC-coupled architecture modeled for GH2, including the 800-volt DC bus, solar, storage, LEDs, existing AC loads, grid service, and backup generation.
Seasonal operation, not annual arithmetic
The proposed solar sites total approximately 1,500 kWdc and are distributed across canopies and rooftops. The study estimates 2,492,565 kWh of annual solar generation, or about 66% of the MLP’s annual energy. But annual energy coverage is only one part of the design problem: the new lighting is concentrated in the cold half of the year, when solar days are shorter.
Accordingly, the analysis modeled battery state of charge and charge-discharge rates at 15-minute resolution under maximum- and minimum-solar winter and summer conditions. In the cold half of the year, LED operations require the battery to complete two cycles per day. The full-year energy-flow analysis also tracked hours of LED shortfall rather than assuming that an annual energy match would guarantee hourly support.
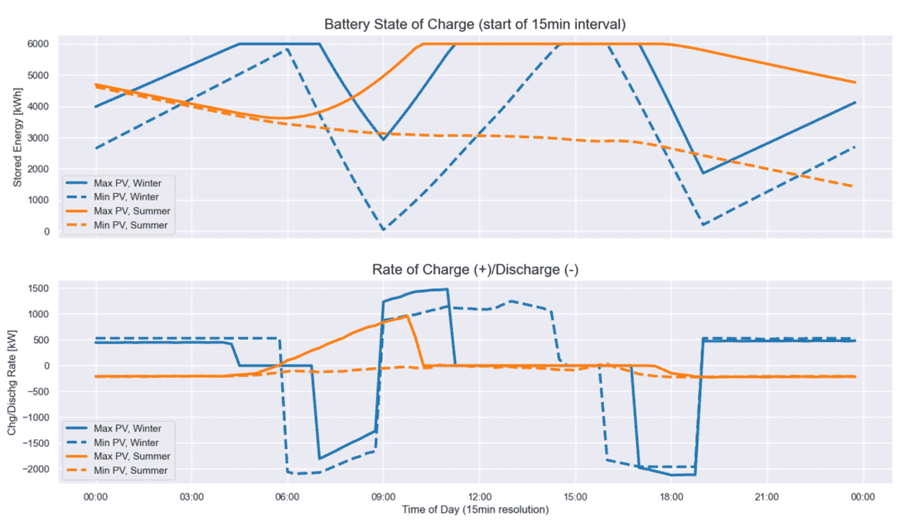
Figure 3. Modeled battery state of charge and dispatch under winter and summer solar conditions. Winter LED operations can require two battery cycles in a day.
The economics of enabling the load
The 25-year cash-purchase analysis used study-era assumptions of $2.50 per watt for solar, $750 per kWh for storage, a 5% annual utility-cost escalator, a 30% Investment Tax Credit (ITC), and federal and California Modified Accelerated Cost Recovery System (MACRS) benefits. The model shows $8.25 million in capital expenditure, approximately $5.08 million in operating and equipment-replacement costs, and $5.24 million in incentives and tax effects.
Against a modeled $8.09 million net total project cost, the study estimates $10.72 million in cumulative utility-bill savings and $2.63 million in net cumulative cash savings over 25 years. The cash-flow table reaches positive cumulative cash flow in Year 12, incorporates a major equipment-replacement cost in Year 16, and returns to positive cumulative cash flow in Year 21.
The study separately estimates $12.39 million in additional Value of Resilience (VOR). That value follows the Clean Coalition’s study methodology, which applies a resilience adder to the electricity bill in proportion to the system’s net-zero-energy contribution. It is presented as an additional value stream, not as cash savings.
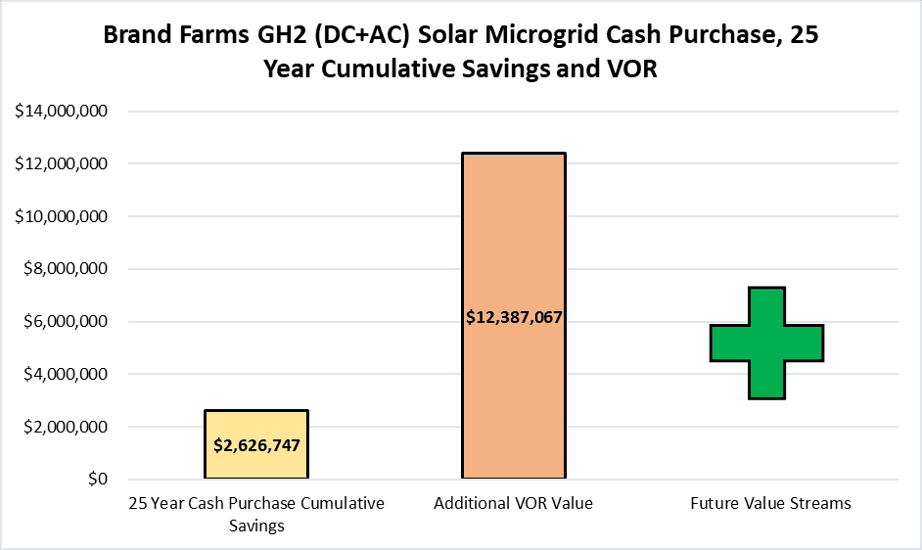
Figure 4. GH2 modeled 25-year net cumulative cash savings and additional Value of Resilience.
Four more meters, four different answers
The February 2023 portfolio study began with a Baseline Load Profile (BLP) for each designated meter, then paired meter-level load shapes with available roofs and canopies. For these four studies, net-zero energy (NZE) expresses modeled annual solar generation as a percentage of annual load; it does not mean that the full meter can operate indefinitely during a grid outage.
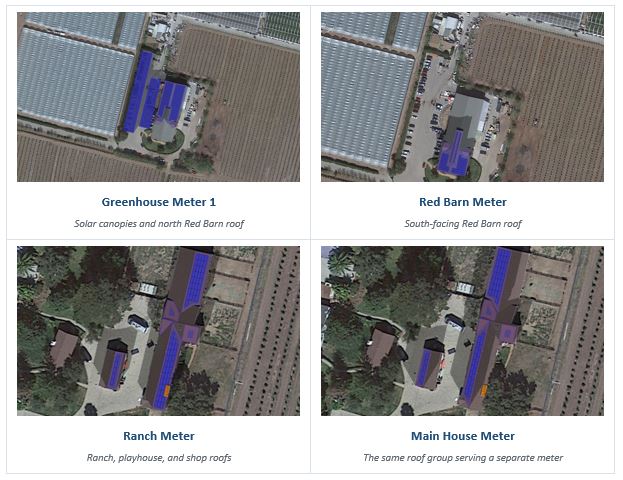
Figure 5. Solar siting concepts for the four additional meters.
Greenhouse Meter 1: a large load with constrained siting
GH1 had a 2,624,228-kWh BLP. The siting concept combined the north-facing Red Barn roof with two main parking-lot canopies for 498 kWdc of solar and 754,348 kWh of modeled annual generation, equal to 29% NZE. The recommended BESS was 1,000 kW / 2,000 kWh.
The resilience model indicates that 10% of total load could be kept online indefinitely in Year 1 and 9% in Year 15 before battery replacement. The preliminary Solar Microgrid cash-flow case shows a $3.49 million upfront cost, a 17.5-year payback, and a 57.6% return on investment (ROI).
Red Barn Meter: near annual net zero on one roof
The Red Barn Meter’s 82,760-kWh BLP was a much closer match for the available south-facing roof. A 56-kWdc solar system was modeled to produce 81,756 kWh annually, or 99% NZE. The BESS was sized at 40 kW / 106 kWh and was modeled to keep 24% of total load online indefinitely in Year 1 and 22% in Year 15.
The preliminary cash-purchase case shows a $326,400 upfront cost, a 7.7-year payback, and a 122.3% ROI. This study demonstrates how a modest roof can become a strong annual-energy match when it is paired with the right meter.
Ranch Meter: more annual solar than annual load
For the Ranch Meter, which serves the ranch, playhouse, and shop buildings, three roof areas support 29 kWdc of solar. Modeled annual generation is 44,700 kWh against a 34,314-kWh BLP, equivalent to 130% NZE. The proposed 10-kW / 26-kWh BESS was modeled to keep 21% of total load online indefinitely in Year 1 and 20% in Year 15.
The preliminary economics show a $133,200 upfront cost, a 6.5-year payback, and a 339.4% ROI. The contrast between 130% NZE and 21% indefinite resilience is important: annual energy balance and outage performance answer different questions.
Main House Meter: similar roofs, a different storage need
The Main House Meter uses the same group of residence-area roofs but a different electrical load. The study modeled 23 kWdc of solar producing 35,200 kWh annually against a 29,223-kWh BLP, or 120% NZE. Its 25-kW / 66-kWh BESS is substantially larger than the Ranch Meter’s battery because the Main House reaches a 22-kW peak, compared with 10 kW at the Ranch Meter.
The modeled BESS keeps 24% of total load online indefinitely in Year 1 and 23% in Year 15. The preliminary cash-purchase case shows a $175,700 upfront cost, a 12.2-year payback, and a 104.2% ROI.
The five-study portfolio at a glance
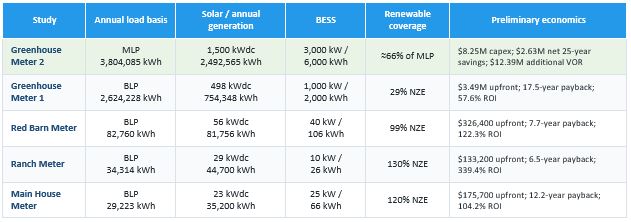
Figure 6. Technical and economic results presented in the five studies. GH2 values come from the May 2023 DC-coupled study; the other four rows come from the February 2023 portfolio study.
The table highlights the portfolio’s central design lesson. Solar size follows usable area and annual load, but storage size also responds to peak demand, load shape, and operating purpose. That is why the Ranch and Main House studies can use similar roof groups yet produce different battery recommendations — and why the GH2 system is in a class of its own.
What the portfolio view reveals
- Meter boundaries matter. One farm can contain several distinct technical and economic projects because each meter sees a different load and a different set of solar resources.
- DC coupling can be an enabling decision. At GH2, the proposed LED load dwarfs the historical AC demand, so the electrical architecture is as important as the quantity of solar.
- Annual NZE and resilience are not interchangeable. A system can produce more energy than a meter uses over a year while still supporting only part of that load indefinitely during an outage.
- Storage follows duty cycle. GH2 requires two battery cycles per winter day to support seasonal lighting, while the smaller meters use storage primarily to shape onsite energy and sustain a portion of load during outages.
- Economics vary across the portfolio. The four February studies show preliminary paybacks ranging from 6.5 to 17.5 years; the May GH2 study instead emphasizes $2.63 million in 25-year net cash savings plus $12.39 million in additional VOR.
From feasibility studies to a portfolio roadmap
Taken together, the five studies give Brand Farms a phased decision framework. GH2 is the strategic anchor because its Solar Microgrid is designed to enable a major new operating load. The Red Barn, Ranch, and Main House studies are smaller and show shorter modeled paybacks, while GH1 addresses a much larger meter with more limited solar coverage.
The most important conclusion is not that one microgrid can be copied five times. It is that a multi-meter agricultural property benefits from one portfolio strategy built from five site-specific designs. Before development, the feasibility results should be refreshed with current utility tariffs, equipment pricing, incentives, tax treatment, site conditions, and detailed electrical and structural design.