Flattening California’s Duck Curve with Local Solar
This blog post by the Clean Coalition discusses how Local Solar can address California's energy grid challenges.
Flattening California’s Duck Curve with Local Solar
Introduction
California’s electricity system faces mounting challenges as it works to integrate renewables and meet climate goals while satisfying energy demand. As the sun sets and remote solar stops generating, natural gas generation spikes to meet increasing demand during evening peak hours. This pattern forms California’s “duck curve.” A myriad of issues arise as a result of this trend:
- The steep evening ramp in demand is met by natural gas generation, disproportionately polluting disadvantaged communities (DAC) where gas plants are located.
- Energy prices are highest during the evening peak-demand period and consumers foot the bill for using energy during each daily peak. Peak demand is likely to rise due to climate change and load growth.
- Increased demand results in a strained transmission grid. Additional costly transmission infrastructure is deployed to meet peak demand, which leads to increasing rates.
Local Solar and battery storage present a powerful solution to these issues by reducing Total Demand (TD) directly on the distribution grid, cutting peak demand, and decreasing the need for expensive transmission infrastructure. Expansions in battery capacity can further enhance the benefits of Local Solar, allowing stored energy to be used during high-demand hours, stabilizing the grid, and reducing emissions. California’s shift toward localized energy generation is essential for achieving a sustainable, resilient, and economically sound energy future. Embracing these solutions will help reduce costs, protect DAC, and meet ambitious environmental goals.
By shifting focus to Local Solar and battery storage, California can reduce peak demand, lower transmission costs, decrease reliance on natural gas, and create a more resilient, sustainable, and economically sound energy system.
Background: The duck chart illustrates California’s electricity demand pattern.
The duck chart illustrates California’s daily electricity demand pattern, with two curves resembling the shape of a duck. The top curve represents TD across 24 hours, and the bottom curve shows Net Demand (ND), accounting for TD minus transmission-interconnected solar and wind. It is important to note that the duck charts’ data, updated hourly by the California Independent System Operator (CAISO), only displays demand for energy that is purchased from CAISO markets.
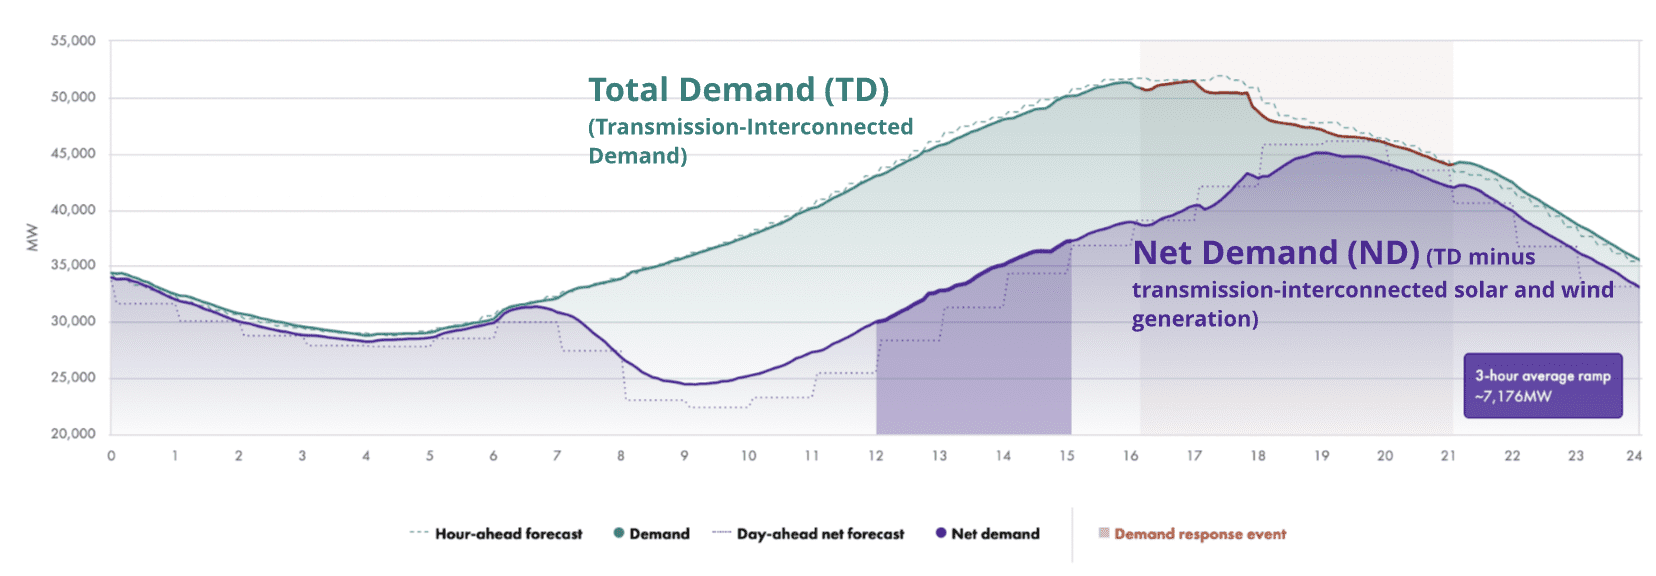 This duck chart of California’s energy demand vs net demand on September 6, 2022, California’s record breaking peak demand day, as depicted by CAISO’s Daily Outlook (CAISO, 2022).
The point furthest to the left on the duck chart represents energy demand at midnight, which is understandably low as most people are sleeping. In the early morning, as the sun rises and people begin to wake up and businesses open, the TD increases. This rise in demand coincides with the rising sun and an increase in remote solar generation, lowering the daytime ND but not resulting in any reduction of TD, creating the “belly” of the duck observed each day (in the above graph, the “belly” of the duck is the space between TD and ND). Demand peaks in the early evening as people return home and turn on their lights and appliances, but with remote solar and wind resources halting, there is a steep upward ramp in ND, requiring rapid dispatch of natural gas. There are several major problems with this system.
Dependence on Remote Solar and natural gas strains California’s energy system.
The steep evening ramp forces grid operators to dispatch natural gas plants quickly, increasing operational costs and emissions. These additional costs fall on the ratepayers. Pollution from natural gas plants disproportionately impacts the communities where they are located, often DAC. It is crucial to eliminate this steep ramp in demand in order to limit the excessive use of natural gas and to mitigate the associated environmental and economic impacts.
Remote Solar reduces ND but does not solve the issue of the evening ramp-up. The following duck chart shows how increased solar capacity has deepened the belly of the duck curve, further steepening the evening ramp and creating more challenges for grid stability. The steep ramp can be addressed best by the deployment of Local Solar, which lowers the TD peak.
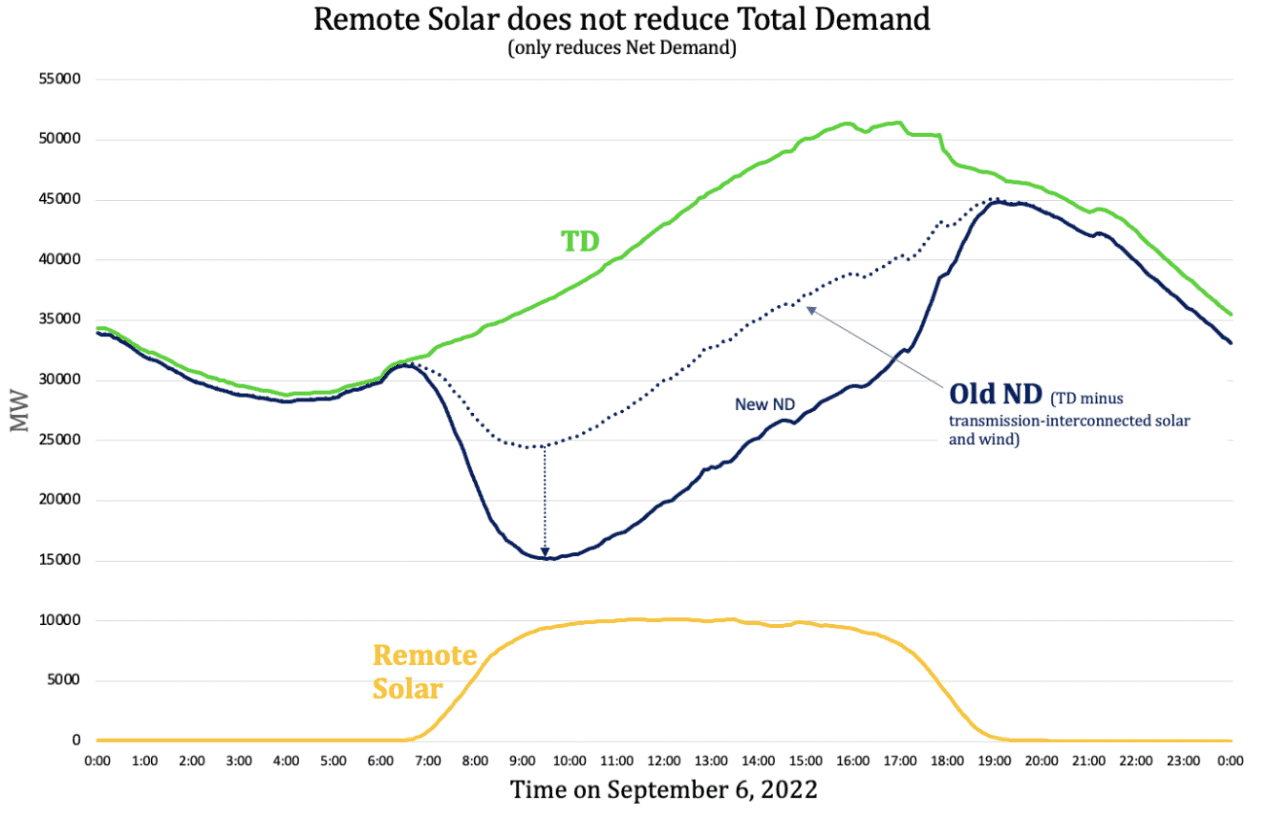 This graph shows that while Remote Solar reduces ND during daylight hours, it does not lower TD. As a result, TD remains high, contributing to steep ramping issues in the evening as the sun sets and solar generation declines.
The slope of the evening ramp increases as Remote Solar deployment accelerates, particularly in the absence of local battery storage. The following graph depicts CAISO’s lowest ND days each spring from 2015 to 2023. ND has been dropping as the number of Remote Solar installations has increased in California, steepening the evening ramp. This trend will continue to worsen without Local Solar reducing the peak TD.
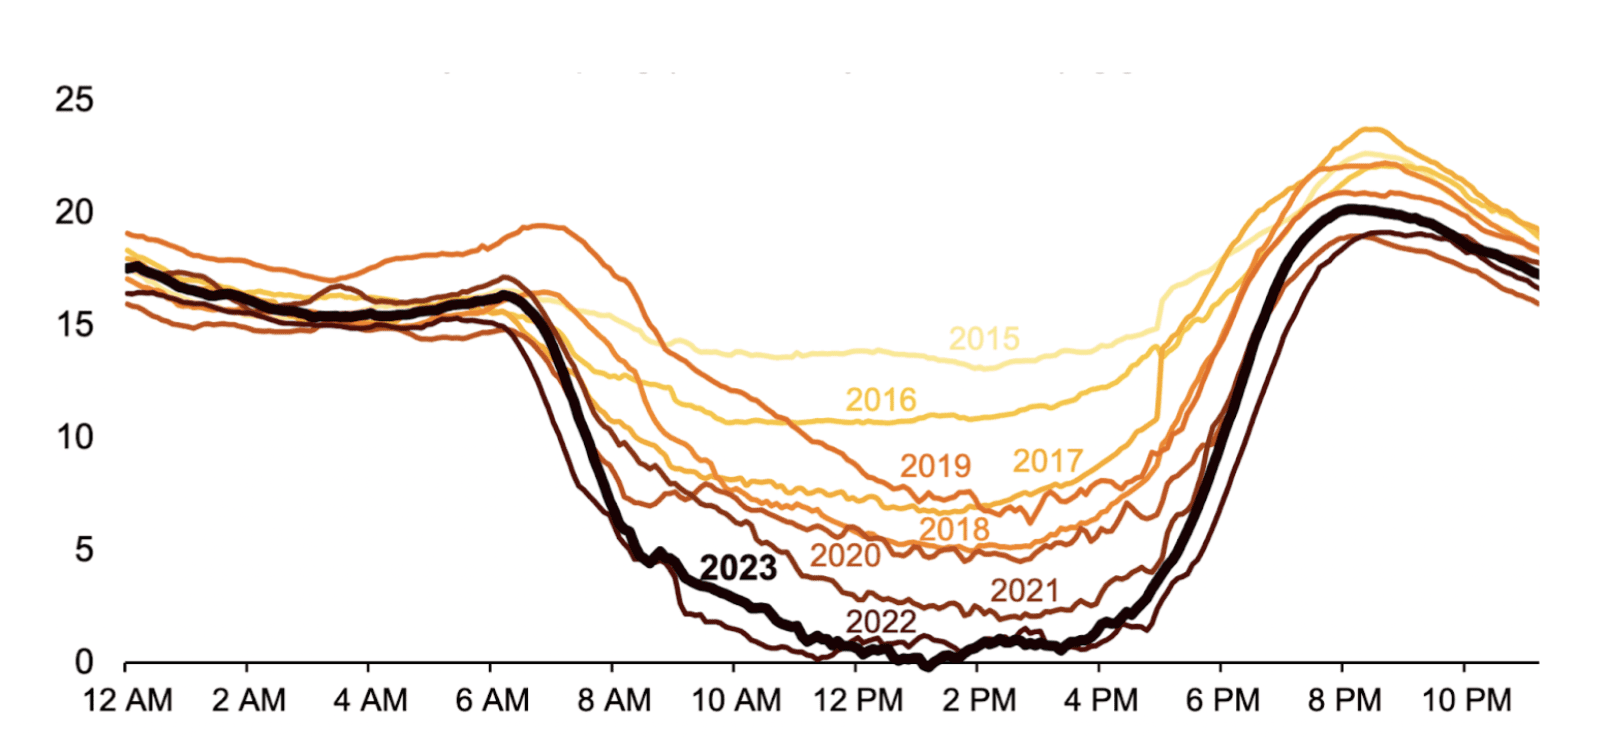 This graph depicts CAISO’s lowest net demand day each spring (in GW) from 2015 to 2023. Due to the increase of Remote Solar capacity, the net demand has progressively gotten lower, fattening the belly of the duck (EIA, 2023).
Although 2024 saw record breaking solar generation, the need to address evening ramping and to decrease reliance on natural gas is more urgent than ever. Local Solar and local battery storage provide a twofold solution by reducing peak TD and improving grid stability, minimizing the strain from peak TD.
The Solution: Local Solar and local battery storage are the keys to solving California’s electricity system problems.
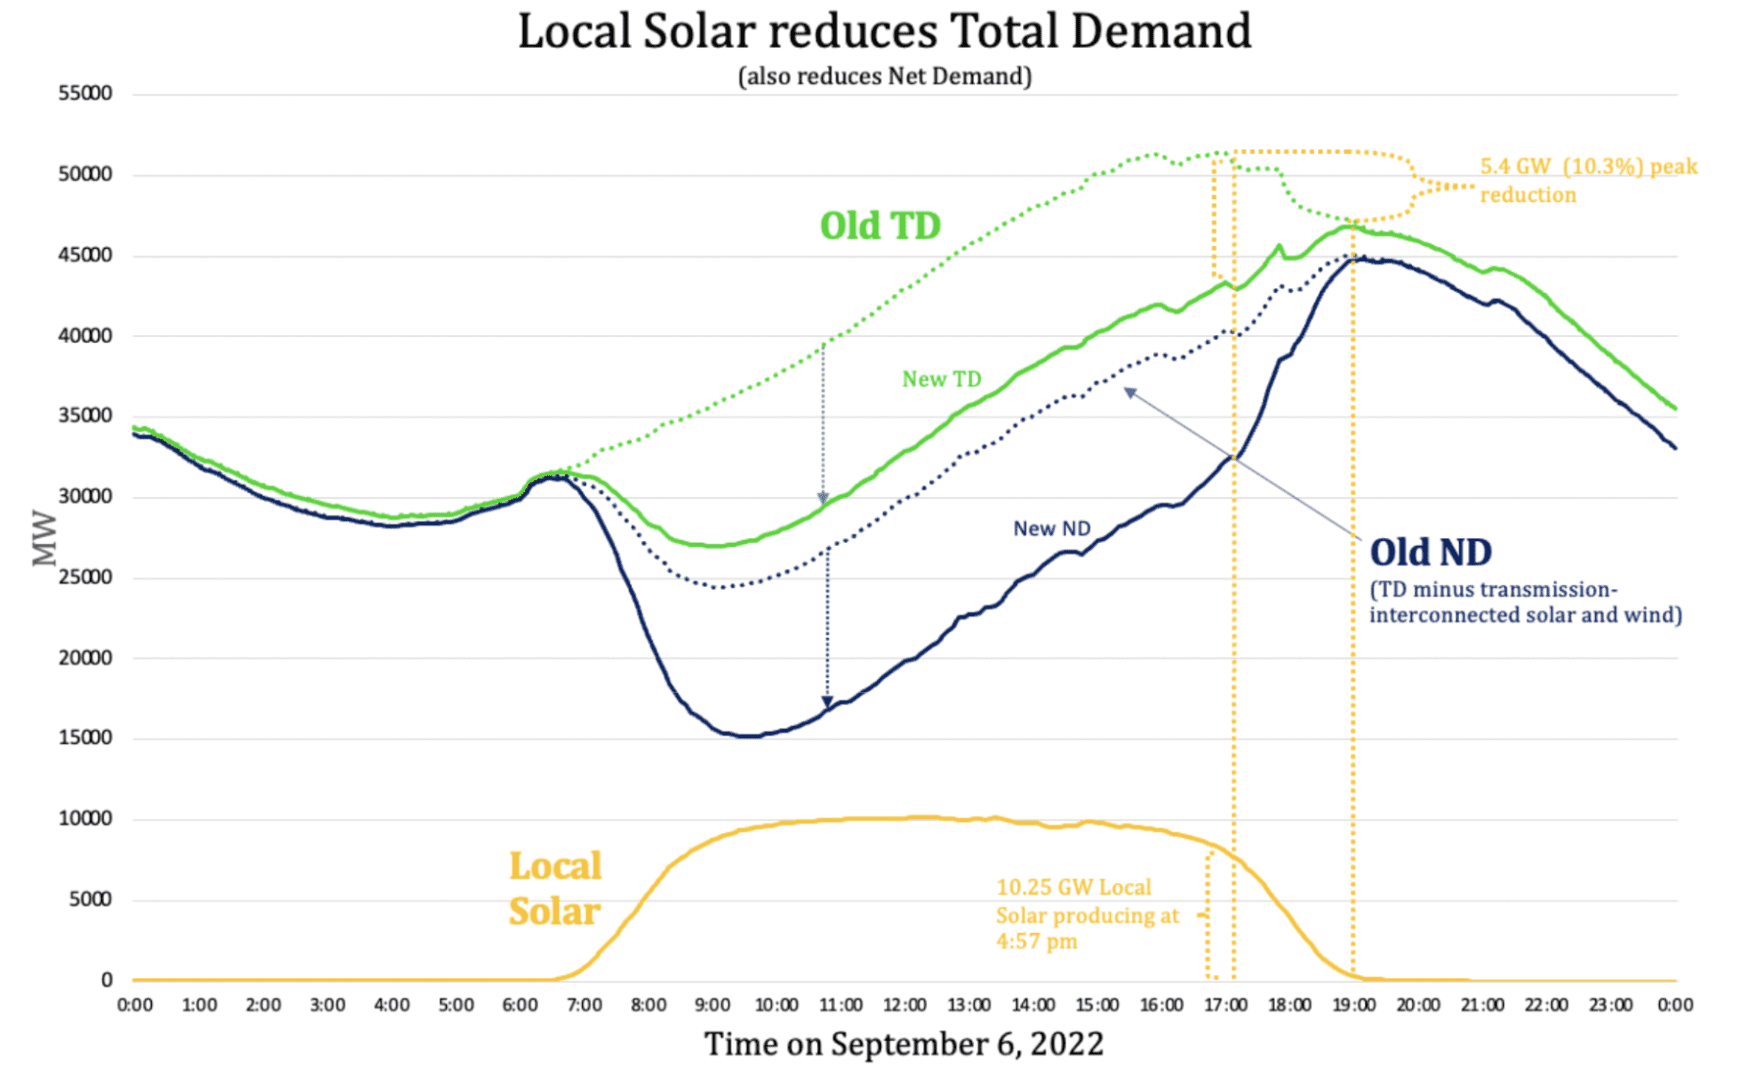
Local Solar lowers TD by providing energy directly on the distribution grid. This reduces the demand on the transmission grid and helps to flatten the demand curve by lowering the “head” of the duck. This reduction minimizes ramping issues and minimizes the need for natural gas. Also, peak transmission usage (ie, peak TD) is the primary cause of new transmission investments and the fastest growing component of electricity bills, so lowering peak TD offers ratepayers hundreds of billions of dollars of avoided transmission costs. This benefit is unique to distributed energy resources (DER), because there is no type of remote generation that reduces transmission usage (Clean Coalition, 2022). The following graph illustrates that the addition of Local Solar lowers TD, reducing ND by the same amount.
This chart shows how an addition of 10.25 GW of Local Solar could reduce California’s peak TD by 5.4 GW (10.3%). This reduction would ease grid strain and lower costs by minimizing the need for transmission and gas generation during peak hours.
The role of battery storage alongside Local Solar in flattening the duck
California witnessed a dramatic surge in battery deployment in 2024. Peak-hour battery discharge more than doubled year-over-year, fueled by the resolution of post-pandemic supply chain issues and a subsequent boom in battery storage projects. The following graph demonstrates this surge in battery storage deployment.
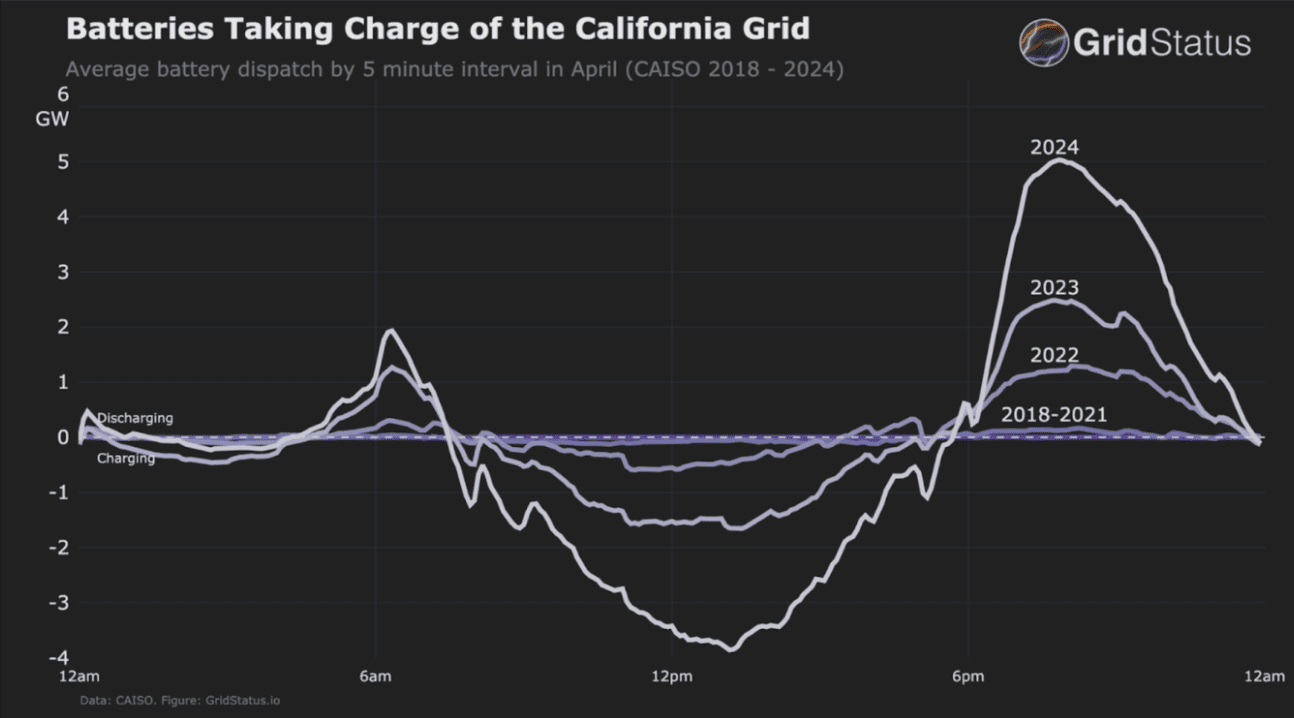 Graph demonstrating drastic increase of battery dispatch from 2018 to 2024 (GridStatus, 2024).
The strategic charging of batteries during peak solar production and their discharge during peak demand hours is reshaping California’s energy landscape. This cycle effectively reduces reliance on natural gas plants for managing demand spikes. With the use of batteries, solar can be used to manage demand spikes previously addressed by natural gas. Consequently, 2024 saw a clear correlation between increased battery storage dispatch and a notable reduction in natural gas generation.
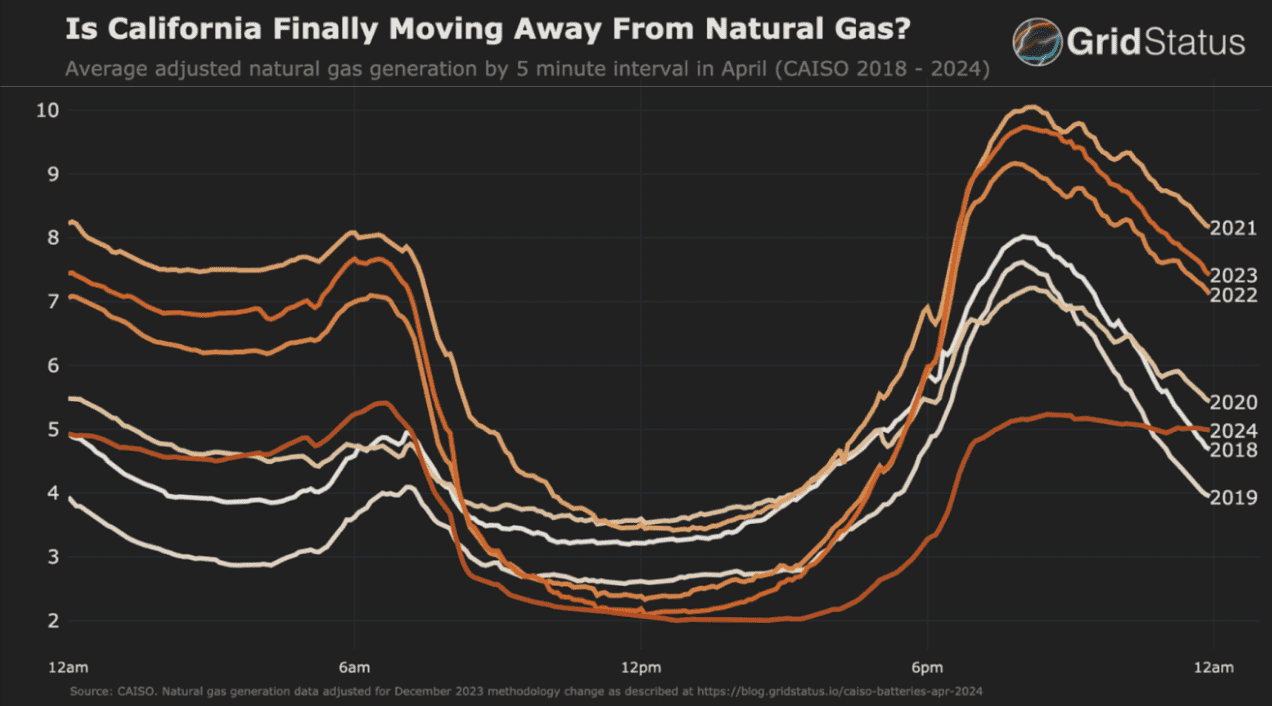 Graph demonstrating that 2024 exhibits decrease in natural gas generation from mid morning (~8:00 am) to late evening (~10:00 pm). The evening peak has plateaued due to batteries assisting with variations of solar output. While natural gas solely used to ramp up generation during the evening when the sun went down, batteries allow energy originating from solar to be dispatched during the evening (GridStatus, 2024).
This decline in natural gas consumption occurred despite a significant drop in gas prices. At SoCal Citygate, a key gas hub for California’s power plants, average daily gas prices plummeted from nearly $9/MMBtu in April 2023 to just $4/MMBtu in 2024 (GridStatus, 2024). The fact that natural gas consumption decreased even as prices fell underscores that this shift is driven by the rise of battery storage and/or other factors, not economic constraints. The following graph further illustrates the capability of battery storage to displace natural gas in CAISO regions.
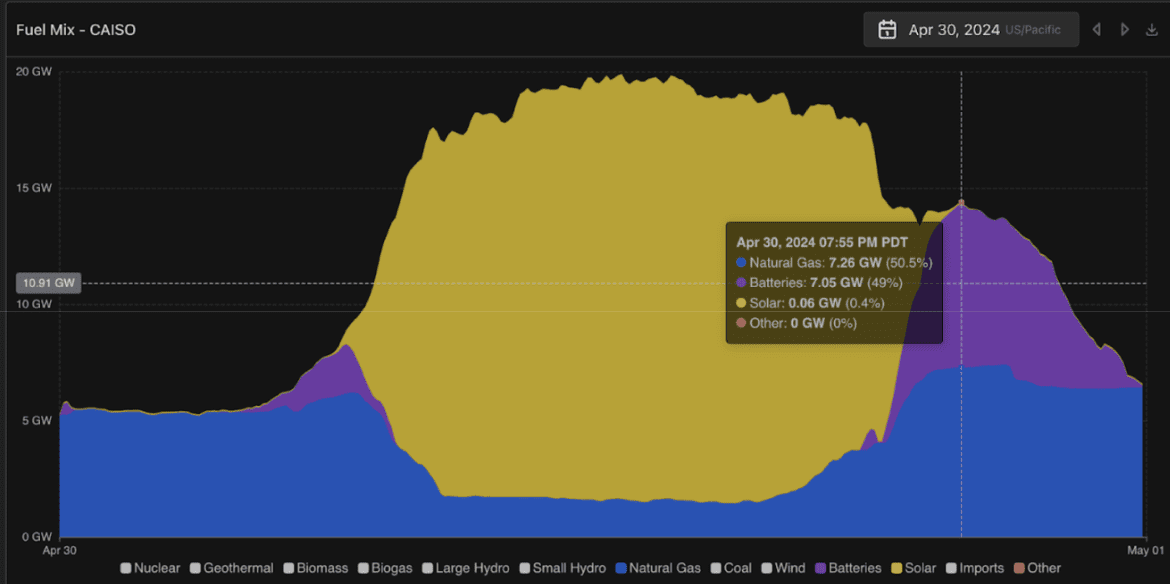 Graph demonstrates the fuel mix during one day in 2024, showing that batteries (purple) displace natural gas (blue) during the evening, and solar dominates during the day (GridStatus, 2024).
In periods when natural gas traditionally ramps up to compensate for diminishing solar output, increased battery storage now allows for the dispatch of timeshifted solar energy during peak demand. As storage capacity continues to grow, we can expect to see an expansion of battery-supplied energy (represented by the purple region in the graph above) and a corresponding shrinkage of natural gas usage (blue region).
Energy storage is indeed poised for significant growth in the coming decades. The California Energy Commission (CEC) reports that the state has achieved 25% of its 2045 energy storage goal. This trajectory points to a dramatic scaling up of battery storage capacity over the next two decades, depicted in the CEC’s graphic.
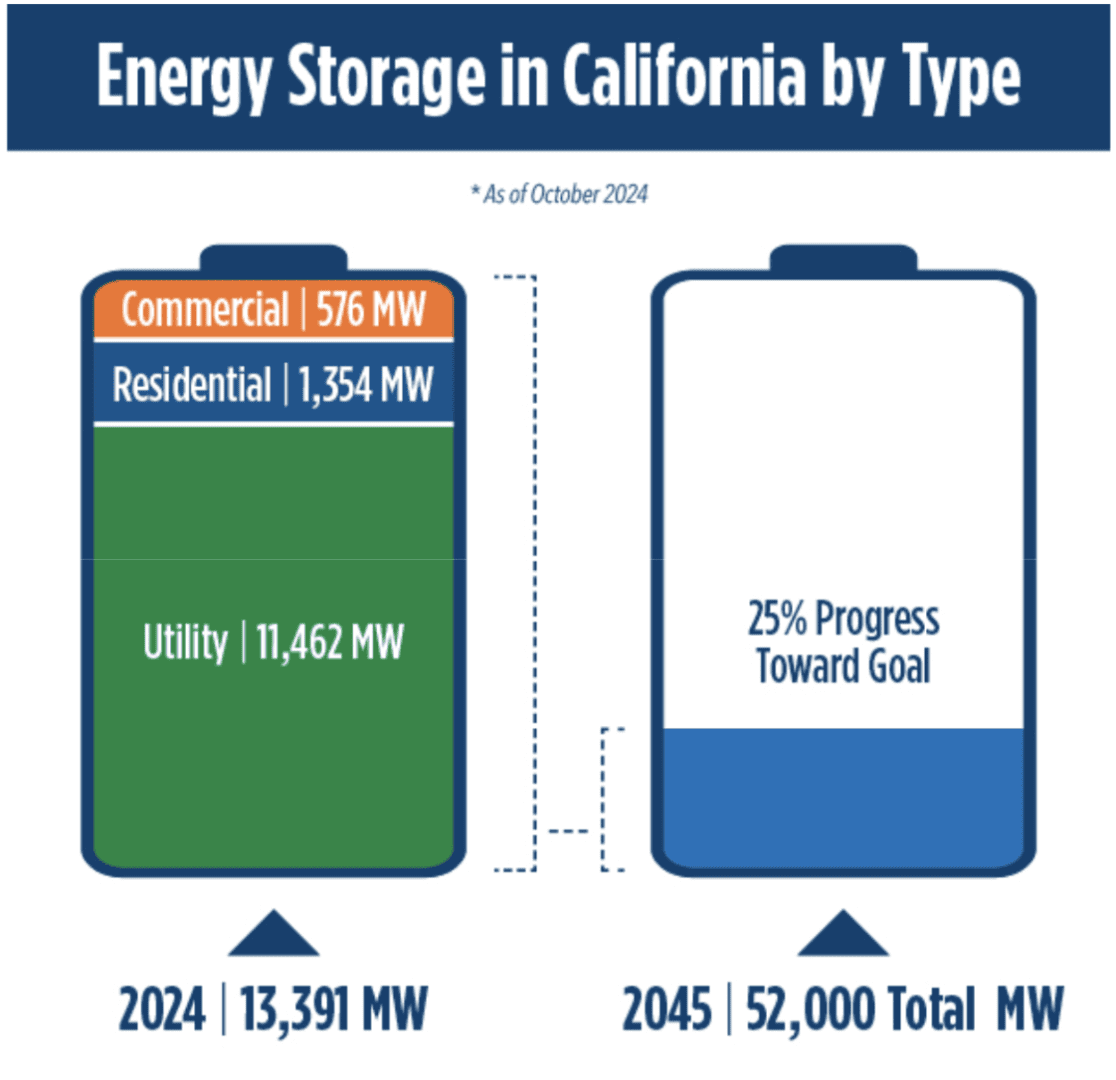 Infographic demonstrating the projected increase in battery storage capacity from 2024 to 2045 (CEC, 2024).
The rise in battery capacity in 2024, with further growth expected, signals the direction California is heading. Pairing Local Solar with local battery storage will significantly reduce transmission usage even more, including most importantly, the peak transmission usage. The result will be enhanced grid stability and ratepayer cost savings.
Conclusion
Expanding Local Solar and local battery storage is critical for addressing the challenges of California’s energy grid. By directly reducing peak transmission usage and limiting reliance on natural gas, Local Solar and storage solutions provide a cleaner, more reliable energy source that lowers costs and emissions. These resources play a vital role in protecting disadvantaged communities and reducing the environmental impacts of natural gas plants. As battery storage capacity grows, California is well-positioned to stabilize its grid and support a resilient energy future.
Local Solar and battery storage are not just enhancements — they are essential to flattening the duck curve, reducing transmission costs, and building an energy system that aligns with California’s sustainability goals.