A big step forward for clean local energy in California: ICA 2.0
The Clean Coalition played a significant role in this major development.
California is poised to take a major step forward in bringing clean local energy online. The Clean Coalition has played a significant role in this progress as a leading advocate for streamlining the interconnection ofwholesale distributed generation (WDG)projects to the electric grid.
WDG refers to distributed generation systems, often commercial-scale solar projects, that connect to the distribution grid and sell the electricity they produce to the local utility to serve local energy demand. The WDG market is severely underserved in the U.S., but California will soon be one step closer to unleashing this crucial market.
That step takes the form of a promising upgrade to the Interconnection Capacity Analysis (ICA) maps provided by California’s major utilities – or ICA 2.0.
Mapping the future of clean local energy
Why are ICA maps so important? For a few simple reasons:
- Interconnection is often one of the most complex, uncertain, and time-consuming aspects of WDG project development.
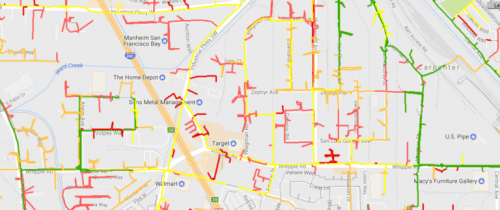
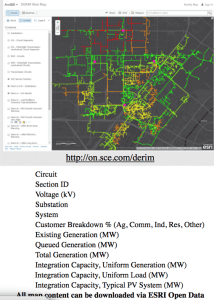
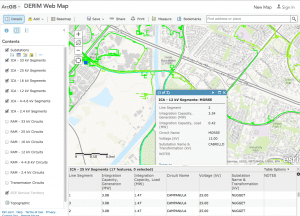
- ICA maps assess all points on the distribution grid to determine how much new WDG, other DG, storage, and load capacity each point can accommodate without significant grid upgrades – making it clear to developers where they can feasibly and cost-effectively site their projects.
- With their extensive details on available interconnection capacity, the maps are powerful tools for bringing WDG online more quickly and cost-effectively.
 The Clean Coalition has consistently advocated for these maps, starting with the first interconnection maps for the Renewable Auction Mechanism (RAM) proceeding in 2011, the initial estimated ICA maps the utilities provided in 2015, and continuing with ICA 2.0.
Why ICA 2.0? The ICA maps that have been available to date were a good start, but they relied on models and assumptions that did not meet the accuracy standards required by interconnection engineers. The new updates, the first full-scale release of ICA maps with reliable data, will provide engineers the high degree of accuracy they need.
The ICA 2.0 maps will offer:
- Highly location-specific information for each node of every line segment
- Detailed hourly data on any operational constraints factors
- Capacity values for specific technologies, such as solar, energy storage, and fuel cells
- Identification of constraints that can be used with Unit Cost Guides to estimate upgrade costs
Challenges in publishing the new maps
In spite of these extremely useful updates, the ICA 2.0 maps are not yet widely available. They were originally scheduled to be published in July, then rescheduled for September 1, and are now expected to be published on December 31. These delays are the result of a CPUC order that requires the utilities to redact some confidential data, such as the location of critical infrastructure. The utilities are in the process of determining how to comply with this requirement.
To understand the challenge the utilities are facing, consider what happens when critical infrastructure information is redacted from a map. The very act of redacting the data from specific locations on a map in of itself identifies the locations of the infrastructure, effectively making that infrastructure easier to find and rendering the redactions ineffective.
 As the utilities grapple with this challenge, a hearing on September 26 and potential public workshops in the next few months will help determine the best way to proceed.
While some utilities across the country have raised security concerns about publishing maps of electric infrastructure, most of these concerns seem unwarranted. The infrastructure in question is not in secret locations; in fact, it’s the wires and facilities clearly visible on every street, as well as in aerial views in map software available on everyone’s computer or smartphone.
California has been publishing grid maps for years, making it significantly more efficient to plan building and energy projects. The new maps don’t reveal new information; what they do is make that information much more reliable.
Accessing the ICA 2.0 maps
Although the ICA 2.0 maps have not yet been made available to the public, access to the most recent maps is available now for DER providers and developers through an NDA application, if they are granted a motion from the Administrative Law Judge showing justification.
UPDATE 10/9/18: On October 9, 2018, Administrative Law Judge Robert Masonruled that the most recent ICA maps should be made publicly available, as they had been previously, without a motion being required to access them. The maps must be made available within five days of the ruling.

