East Los Angeles Solar Microgrids Feasibility Study
In partnership with Los Angeles County, the Clean Coalition produced a Solar Microgrids Feasibility Study showcasing the resilience benefits and electricity bill savings to LA County
In partnership with Los Angeles County, the Clean Coalition has produced a Solar Microgrids Feasibility Study for three critical community facilities.
As described in a December 2021 blog post, the Clean Coalition partnered with the County of Los Angeles (“LA County”) to conduct a Solar Microgrids Feasibility Study for three critical community facilities (CCFs) within the East LA hub. Our recently completed analysis has produced findings that indicate significant economic, environmental, and resilience benefits for LA County and its East LA community that would result from the development of these projects. The three CCFs studied in the East LA Hub are:
- Edward R. Roybal Health Center
- East LA Civic Center
- East LA Library

Project scope and deliverables
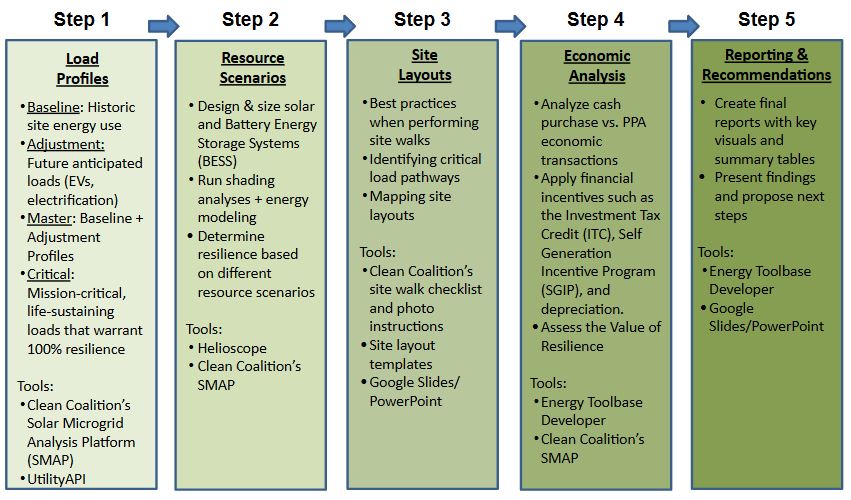
The project’s objectives and scope were to assess the technical and economic feasibility of Solar Microgrids for the three CCFs. The fundamental economic benefits were evaluated based on bill savings and additional economic benefits were calculated based on value-of-resilience (VOR), which includes the value of minimizing the use of an existing diesel generator and eliminating any need for additional diesel generators. The feasibility study followed the Clean Coalition’s Solar Microgrid Methodology, which involves five main steps, as follows:
- Step 1 – Load Profiles: Develop profiles for existing electricity loads over a representative 12 month period and then adjust for expected changes due to anticipated EV charging, electrification of heating and other applications, and new construction. Also develop profiles for critical loads that need to be maintained for limited periods of time – and critical loads that need to be maintained indefinitely, regardless of grid outage durations.
- Step 2 – Resource Scenarios: Investigate all possible onsite energy resource options that are technically viable for each site while optimizing the economic, environmental, and resilience objectives.
- Step 3 – Site Layouts: Develop the site layouts to clearly illustrate recommended locations and sizing for all generation resources, locations for energy storage, and to detail locations of key electrical assets like the customer meter and critical loads.
- Step 4 – Economic Analyses: Analyze the total costs and economic benefits of each of the viable Resource Scenarios at each site.
- Step 5 – Reporting & Recommendations: Present the results and recommendations via project review meetings, presentations, and reports.
These five steps are diagrammed below, with additional descriptions following the diagram:
Step 1: Load Profiles
The first step creates the anticipated load profiles by analyzing the historical and projected electrical load amounts for each site. Due to the load impacts of COVID-19, the latest pre-covid year of 2019 was deemed to be most appropriate for the historical annual load data. This data was provided by LA County and was then completed in order to fill in any missing data. This 2019 annual load data then became the baseline load profile, which forms the basis for creating the master load profile.
The master load profile adds future expected loads or load modifications to the baseline load profile in order to accurately assess the total load per location over time, thus informing the optimal sizing of the solar and storage. LA County has plans to install electric vehicle (EV) charging stations county-wide, and they determined that 10 Level-2 EV charging stations should be modeled behind the Health Center meter. This required modeling the additional load from the charging stations and then adding it to the baseline load profile, resulting in the creation of the master load profile for the Health Center. It was also determined that no additional EV charging stations or energy efficiency modeling should be included at the East LA Civic Center or Library, which means that the baseline load profiles became their master load profiles for those two sites.
A different approach was used to create the critical load profile for the Health Center, than what was used for the Civic Center and Library. The Health Center, which has an existing Emergency Distribution Switchboard (EDS) that is currently served by a diesel generator, is sized to be 20% of the Health Center’s total load. This 20% was sized against the master load profile to create the critical load profile.
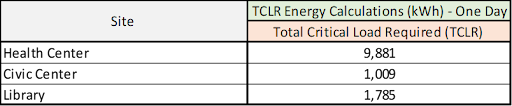
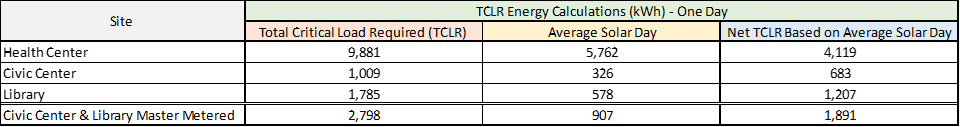
Developing the critical load profiles for the Civic Center and Library sites were based on a Clean Coalition methodology called Total Critical Load Required (TCLR). The TCLR is the total energy consumed by critical loads over a specified time frame. For both the Civic Center and Library, the critical loads were determined to be the entire site load over the course of one day.
Step 2: Resource Scenarios
The second step estimates the solar and storage needed to meet the critical load profile requirements for each site. Due to siting constraints, the solar potential for each site was maximized based on the amount of solar available for each site. Since the Health Center has the largest critical load, the solar potential on the Health Center’s roof, the main parking lot and parking garage, were determined to serve the Health Center.
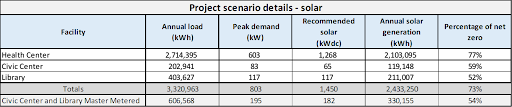
The solar siting potential for the Civic Center and Library were sized for their full rooftop potentials. Both the Civic Center and Library also have electrical meters right next to each other, enabling an opportunity to combine those meters into a single master meter which would result in an even more optimal outcome of using solar across those two roofs. The following table lists the annual load, peak demand, and recommended solar sizing per site, including how much on a percentage basis the solar would achieve net-zero energy.
To account for the solar generation in the TCLR calculation, the Net TCLR was calculated by taking the average solar energy generation for each site’s solar siting potential, for one day, and subtracting it from the TCLR for each site respectively. This resulted in Net TCLR values that became the basis for sizing the battery energy storage system.
To size the battery energy storage system for the Health Care Center, the Clean Coalition used a proprietary inhouse tool that incorporates historical solar generation and annual load profiles in order to maintain a predefined percentage of a site’s total load indefinitely. To maintain the Health Center’s EDS (sized at 20% of the sites total load), indefinitely, while also accounting for battery degradation, a battery energy capacity was calculated.
The sizing of the battery energy storage systems at the Civic Center and Library were completed using the Net TCLR values, sized up to account for degradation. The following table lists the recommended battery sizes and the total percentage of load that can be kept online indefinitely using each site’s recommended solar and storage sizes.

Step 3: Site Layouts
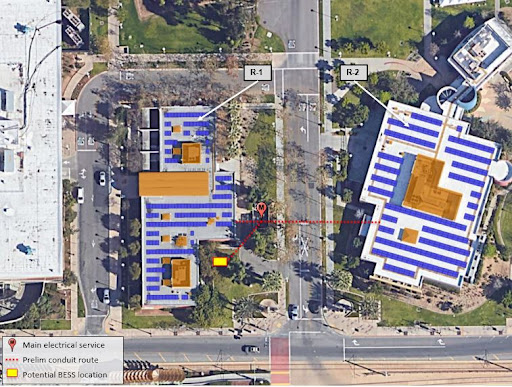
The third step features development of site layouts based on the previous steps. Illustrating the recommended locations of the solar and energy storage, through the creation of site layouts, is vital for telling a story and for informing key decision makers. These site layouts also include the locations of other key electrical assets like customer meters, existing or planned EV charging stations, critical loads, and existing diesel generators.
Each site layout comprises a single page with a legend, which label key site layout icons, and call out boxes, which point to the location of the energy resources and critical loads. See the end of the blog post for the two site layouts prepared for the three East LA County sites.
Step 4: Economic Analysis
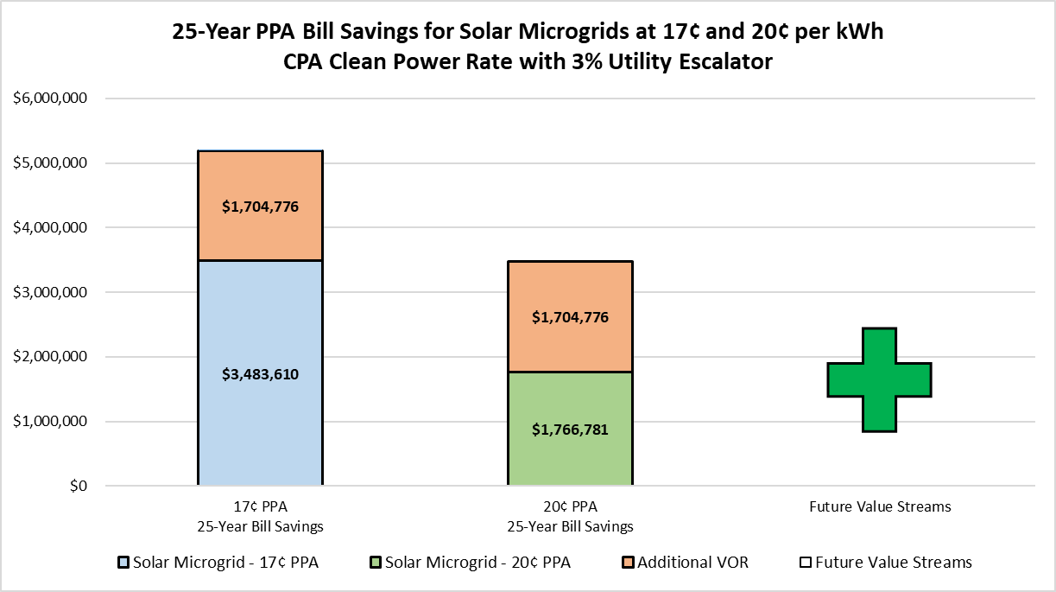
The fourth step provides the economic analysis of the proposed Solar Microgrid solution. Using industry standard tools, an economic analysis was performed, and the results provided LA County with key details. Over a 25-year period, two financing options were analyzed: 1) a “Cash” option – financing the Capital Expenditure (Capex) and Operating Expenditure (Opex) costs for each system; and 2) a Power Purchase Agreement (PPA), which is an established, industry-standard financial solution requiring no upfront cash nor operating or maintenance expenditures. With a PPA, site owners pay using an energy services contract – similar to paying for electricity from a utility – but based on the amount of solar energy (kWh) the system delivers, whether via solar in real-time or time-shifted via a battery. Being a municipality, LA County would be unable to take the tax benefits under the cash financing option, and with no upfront cash outlay required under the PPA, this option is much more appealing. For the economic analysis, the Clean Coalition set two fixed PPA prices of 17¢ and 20¢ and expects that the actual PPA price would likely fall somewhere in the middle.
Based on the economic analysis results as shown in the bar graph below, over 25 years the fixed-rate 17¢ PPA would yield $3,483,610 in electrical bill savings for LA County. With the Solar Microgrids, LA County would also receive indefinite renewables-driven resilience, worth an additional $1,704,776, plus potential for future value streams such as the energy storage providing benefits to grid operations that receive compensation and EV charging revenue for the county.
Step 5: Reporting & Recommendations
Key Findings
- Based on the detailed economic analysis for LA County, the following are not preferred:
- Solar only: this would provide zero resilience and the need for the continued use and the installation of dirty diesel generators.
- Cash purchase option: incurs a high upfront cost without the ability to take the tax benefits of the system, which often pay for up to 50% percent of the install cost.
- By contrast, a Solar Microgrid for all three sites under a PPA agreement would provide LA County with tremendous economic and resilience benefits:
- PPA option: save LA County between $1.7 and $3.5 million dollars over the 25-year period.
- Unparalleled resilience: maintain each site’s critical loads for a significant portion of time, translating to $1.7 million in Value of Resilience.
Recommendations and next steps
The Clean Coalition’s final recommendations to LA County included moving forward with a Request for Proposals (RFP) to deploy the Solar Microgrids as proposed for each site under the PPA financial option. In addition, the Clean Coalition recommended that additional feasibility studies be conducted at surrounding sites within the East LA Hub and at other LA County hubs. Lastly, we recommended initiating substantial conversations with Southern California Edison (SCE) to deploy a Community Microgrid for the East LA Hub and potentially beyond. A Community Microgrid is a broader solution that will bring additional economic and resilience benefits to LA County.
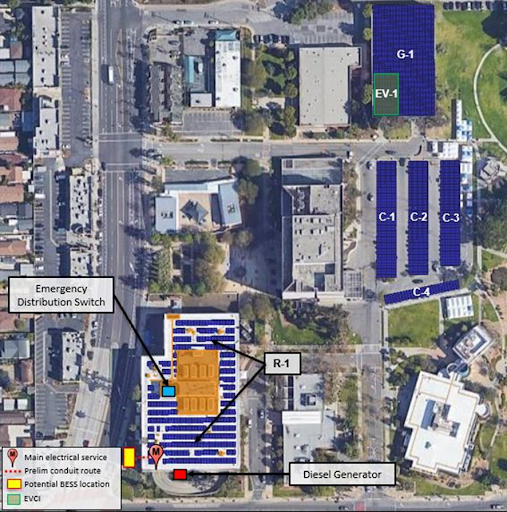
East LA Site Layouts
Following are the site layouts that display the recommended Solar Microgrid for each of the three East LA locations.
Edward R. Roybal Health Center
Total annual load and peak demand:
- Baseline load profile: 2,637,146 kWh
- Master load profile: 2,714,395 kWh
- Peak demand: 603 kW
Total solar recommended
- 1,268 kWdc
Solar recommended by location:
- R-1: 317 kWdc
- C-1: 154 kWdc
- C-2: 150 kWdc
- C-3: 139 kWdc
- C-4: 46 kWdc
- G-1: 462 kWdc
Solar to NZE:
- Baseline load profile: 1,599 kWdc
- Master load profile: 1,646 kWdc
Battery energy storage recommended:
- 500 kW/ 2,230 kWh
Electric vehicles:
- EV-1: Ten new L2 ports
- Estimated annual load of ten L2 charging ports – 77,249 kWh
Critical loads
- 20% of total load is critical
- Net TCLR: 4,119 kWh
East LA Civic Center and Library
Total annual load and peak demand:
- Master load profile: 403,627 kWh
- Peak demand: 195 kW
Total solar recommended
- 182 kWdc
Total solar recommended by location
- R-1 (Civic Center): 65 kWdc
- R-2 (Library): 117 kWdc
Solar to NZE:
Master load profile: 369 kWdc
Battery energy storage
- 500 kW / 2,790 kWh
Critical loads
- Net TCLR: 1,891 kWh
- 46% of total load can be kept online indefinitely in Year 1.