Town of Moraga Energy Generation Study
In partnership with the Town of Moraga, the Clean Coalition produced an Energy Generation Study showcasing the resilience benefits and electricity bill savings to the Town.

In partnership with the Town of Moraga, the Clean Coalition produced an Energy Generation Study showcasing how Solar Microgrids can provide critical resilience and substantial electricity bill savings to the Town.
“Community Resilience” is a much-needed solution and growing hot topic across the country and the world. Communities are experiencing the need to add onsite energy resources in the form of Solar Microgrids at key facilities, in order to keep essential services running due to increasingly common extreme weather events, which often cause extensive grid outages.
In the spirit of bringing resilience to communities, the Clean Coalition completed an Energy Generation Study for the Town of Moraga in order to analyze optimal energy and resilience solutions for four Town of Moraga Critical Community Facilities (CCFs). The Clean Coalition conducted this study by obtaining and analyzing the energy usage at each of the four Town properties, forecasting the expected future energy usage, determining the critical loads required to be served without interruption by onsite energy generation and storage during grid outages, and evaluating the economic benefits.
This study provided the Town of Moraga with specific recommendations for how to preserve essential services during grid outages by utilizing onsite energy generation and storage at key facilities, while also saving the Town substantial money. The specific results and recommendations in this study will enable the Town of Moraga to proceed with onsite energy generation combined with energy storage (known as Solar Microgrids) at four targeted CCFs, providing the Town with these two significant benefits:
- Providing critical resilience – keeping essential services such as town operations, healthcare, police, comfort, food, Internet access, etc active during grid outages, which are becoming more frequent and intense – AND
- Improving the Town’s budget – providing substantial bill savings on the Town’s electricity bills, resulting in a projected net savings of $1.8 million.
The four properties analyzed for this study are the Town Hall & Police Offices, the Council Chamber & Corporation Yard, the Library, and Hacienda de las Flores Park. The study incorporated multiple Town of Moraga program and project goals including many associated with responding to climate change and delivering an unparalleled trifecta of economic, environmental, and resilience benefits.
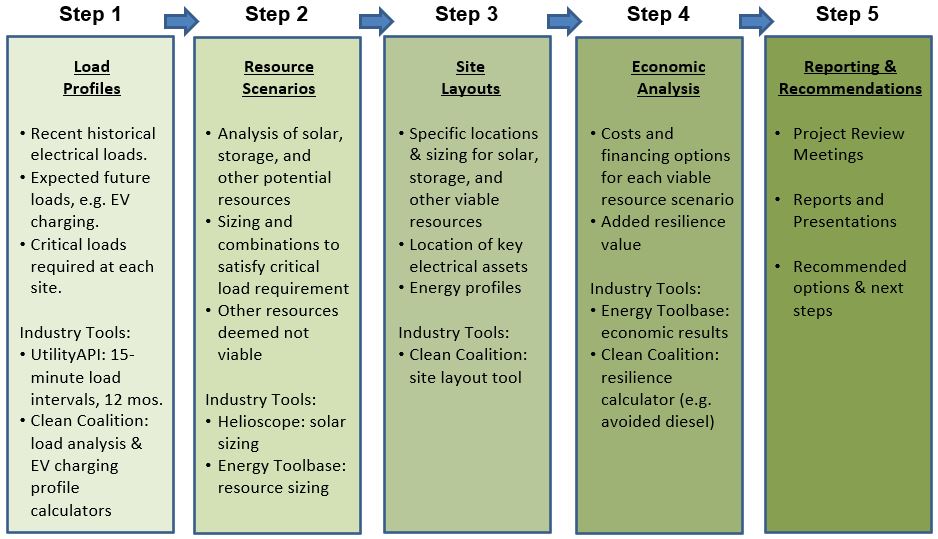
The Clean Coalition conducted this study by utilizing its proven methodology for analyzing energy resource and resilience solutions on behalf of communities, featuring the following five steps:
- Step 1: Load Profiles: Develop profiles for existing electricity loads over a relevant 12 month period and then adjust for expected changes due to anticipated EV charging, electrification of heating applications and other appliances, and new construction. Also develop profiles for critical loads that need to be maintained for limited periods of time – and critical loads that need to be maintained indefinitely, regardless of grid outage durations.
- Step 2: Resource Scenarios: Investigate all possible onsite energy resource options that are technically viable for each site while optimizing the economic, environmental, and resilience objectives.
- Step 3: Site Layouts: Develop the site layouts to clearly illustrate recommended locations and sizing for all generation resources, locations for energy storage, and to detail locations of key electrical assets like the customer meter and critical loads.
- Step 4: Economic Analyses: Analyze the total costs and economic benefits of each of the viable Resource Scenarios at each site.
- Step 5: Reporting & Recommendations: Present the results and recommendations via project review meetings, presentations, and reports.
These five steps are diagrammed below:
Step 1 – Load Profiles:
The load profiles are developed to calculate the following: Baseline Load Profile, the existing electricity loads over a relevant 12 month period; Master Load Profile, adjustments to the Baseline for expected increases or changes due to anticipated EV charging, electrification of heating applications and other appliances, and new construction; and Critical Load Profile, the loads that need to be maintained during outages for limited periods of time – and including critical loads that need to be maintained indefinitely, regardless of grid outage durations.
For the Baseline Load Profile, the Town of Moraga staff determined that it was most accurate to use 2019 electricity load data for each site, given that 2020 and 2021 were impacted by COVID and the sites used a lower than accurate amount of energy during those years. Using the 2019 load data as the Baseline Load Profile, the Master Load Profile was then prepared, primarily by adding anticipated EV charging loads to specific sites as expected in the near future, e.g. five years.
Based on discussions with the Town of Moraga staff, it was determined that specific resilience profiles would be used to calculate the Critical Load Profiles for each site. These resilience profiles require that the proposed energy resources can provide uninterrupted backup power to the critical loads for five consecutive days, enabling each site to withstand any expected or unexpected grid outage with energy provided to all critical loads. Based on this, the Total Critical Load Required (TCLR) was calculated for each Town of Moraga site. Note that the TCLR calculations are based on the most conservative numbers to ensure that the resource scenarios will provide electricity for the 5-day TCLR under the most conservative timeframes using the expected highest electricity use combined with the lowest solar generation.
The TCLR calculations for each site are summarized in the table below:
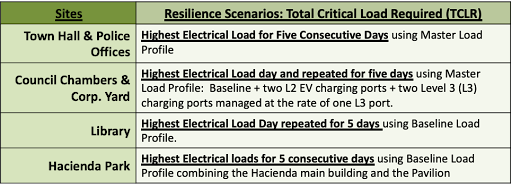
It was determined that EV charging would be included in the TCLR for Town Hall & Police Station and considered for the Corporation Yard & Council Chambers, but not for the Library or Hacienda sites. Nonetheless, EV charging can be available for all sites when solar generation is abundant. Also, where available, peak load testing details previously conducted by Moraga were used to help evaluate the TCLRs.
Step 2 – Resource Scenarios:
Based on the load profiles, the Resource Scenarios were analyzed to assess specific options and sizes of energy resources that are appropriate to be located at each site. The Clean Coalition conducted in-person visits to each site with the Town of Moraga staff in order to determine the existing electrical configuration and the viable opportunity and locations for new energy resources including solar generation, energy storage, and diesel generators.
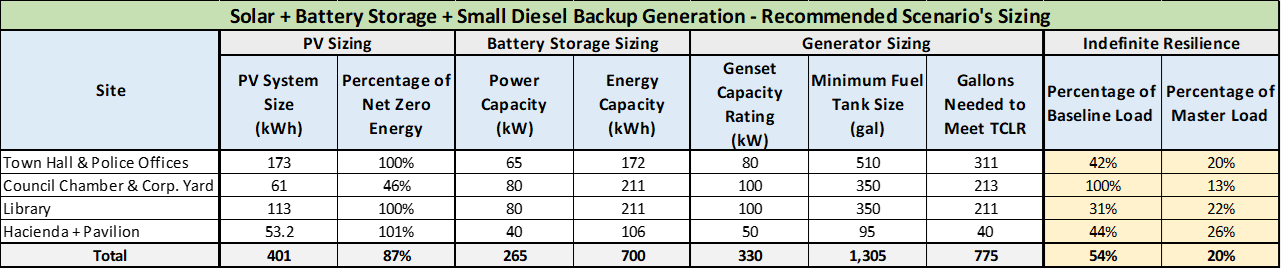
The solar potential for each site was designed to accept realistic sizing for solar panels while achieving a key goal of delivering a Net Zero Energy (NZE) outcome for each site where applicable, with the solar generation equaling the amount of electricity used at each site on an annual basis, thus resulting in significant electricity bill cost savings.
Based on the detailed analysis, the following table lists the recommended Resource Scenario for each of the four sites – a Solar Microgrid (solar + battery storage) + small diesel backup generator – and the specific sizing:
Step 3 – Site Layouts:
Based on the results of the previous two steps – Load Profiles and Resource Scenarios – and utilizing site visits to visually ascertain the most optimal solutions, the actual site layouts were developed. The site layouts illustrate the recommended locations with sizing for the onsite energy generation via solar, the recommended locations for energy storage, locations of key electrical assets like the customer meter and critical loads, and the resulting energy profiles for each site.
After review and input from the Town of Moraga staff, the detailed site layouts were developed that display the proposed locations and sizing for the viable energy resources including solar panels and/or solar carports, proposed locations for added EV charging, and locations of existing generators and potential new generators. Each site layout comprises a single page – see below for the four site layouts prepared for the four Town of Moraga sites.
Step 4 – Economic Analysis:
Based on the resulting Resource Scenarios, the Economic Analysis was conducted to determine the total cost and cost benefits for each viable Resource Scenario. Note that since each Resource Scenario satisfies the TCLR for each site during an outage, the comparison of the scenarios can focus largely on the economic results.
The economic analysis for each site demonstrates that utilizing solar + diesel or a Solar Microgrid (solar + battery storage) + backup diesel provides the Town of Moraga with significant cost savings for each site, resulting in a 25-year cumulative net savings over the life of each of these scenarios.
Based on the Economic Analysis, the following table provides the results of the recommended solution for the Town: Solar Microgrid (solar + battery storage) + small diesel generator. As stated, this scenario would provide the full resilience needed for the Town’s critical and essential services, while ALSO providing the town with a projected net savings of $1.8 Million over 25 years.
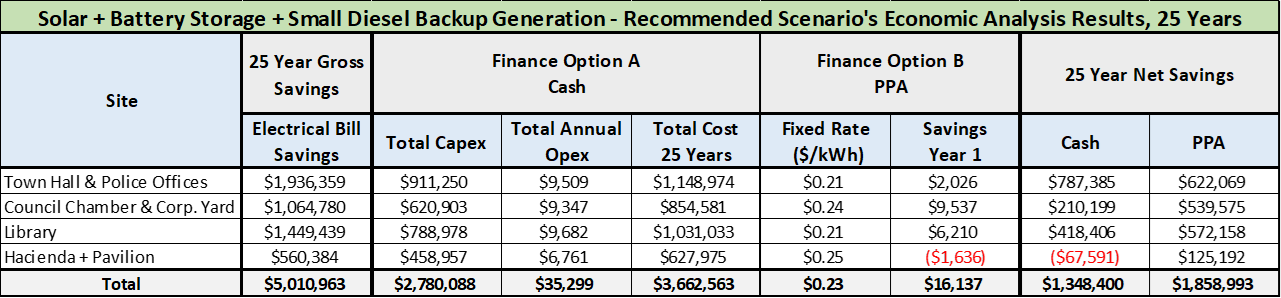
As summarized in the table above, the Economic Analysis evaluates financing each scenario via the following two options:
- Option A: “Cash” option – paying the Capital Expenditure (Capex) and Operating Expenditure (Opex) costs for each system
- Option B: Power Purchase Agreement (PPA). PPAs are an established, industry-standard financial solution requiring no upfront cash nor operating or maintenance expenditures. With a PPA, site owners pay using an energy services contract – similar to paying for electricity from a utility – but based on the amount of solar energy (kWh) the system delivers, whether via solar in real-time or time-shifted via a battery.
Step 5 – Reporting & Recommendations:
Key Findings:
- Based on the detailed economic analysis, the following are not preferred:
- Solar + storage: high capital cost at over $8M
- Diesel only: high operating cost, no savings, least environmentally friendly
- By contrast, a Solar Microgrid (solar + storage) + small diesel generator or solar + diesel would each save Moraga over $1.8 million over 25-years
- Under Finance Option A, Cash / Design-Build, the two recommended Resource Scenarios would cost:
- $2,600,891 for the solar + diesel
- $3,662,563 for the Solar Microgrid (solar + storage) + small diesel generator
- Under Finance Option B, the PPA, the two recommended Resource Scenarios would require no upfront cost while including all maintenance and operations costs.
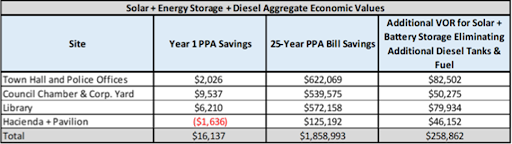
- In addition, the Solar Microgrid (solar + storage) + small diesel generator option provides ongoing, indefinite support for a percentage of loads during outages, while also providing additional Value-of-Resilience (VOR) of over $250,000, thus bringing the total savings to Moraga for this Resource Scenario at over $2.1 million.
The following chart and table displays the aggregate economic values for the Solar Microgrid (solar + storage) + small diesel generator Resource Scenario using the PPA finance option. The table lists the economic results for each site with Year 1 savings, Year 25 savings, and the additional VOR due to energy storage eliminating the additional diesel tanks and fuel that otherwise would be required in order to support the same amount of critical loads.
Note that there is additional value that can be achieved by energy storage providing services to the grid, such as reducing peak loads. This is a potential future value stream, not quantified in this study. EV charging can also provide a revenue stream, and the town’s EV vehicles can also save money versus paying for gasoline.

Town of Moraga Site Layouts
Following are the site layouts that display the recommended Solar Microgrid for each of the four Town of Moraga locations, including the detailed energy profile for each site:
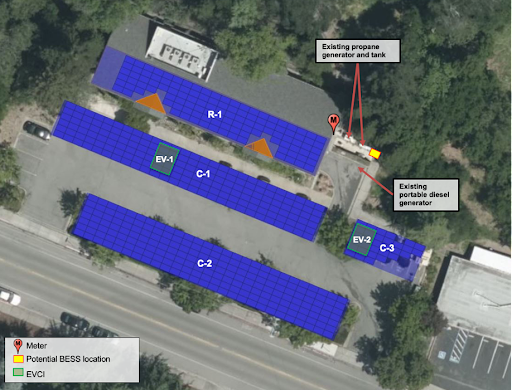
Town Hall & Police Offices
Total annual load:
- Baseline load profile: 116,338 kWh
- Master load profile: 260,640 kWh
Solar sizing by recommended location:
- R-1 (Rooftop): 39.2 kWdc
- C-1 (Carport): 56.7 kWdc
- C-2: 66.2 kWdc
- C-3 (Carport): 10.9 kWdc
- TOTAL: 173 kWdc
Solar to Net Zero Energy (NZE):
- Baseline load profile: 76 kWdc
- Master load profile: 173 kWdc
Critical loads
- 100% of load is critical.
- Police station, Town offices, and Emergency Operations Services for Town functions.
Electric Vehicle Charging
- EV-1: Two existing L2 SemiConnect ports for employee and public use
- EV-2 Two new L2 ports for police use.
- Estimated annual load of four L2 charging ports – 144,302 kWh
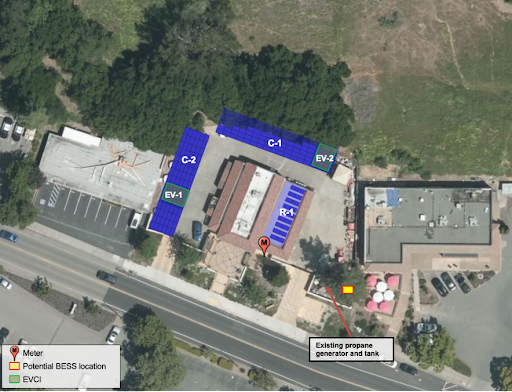
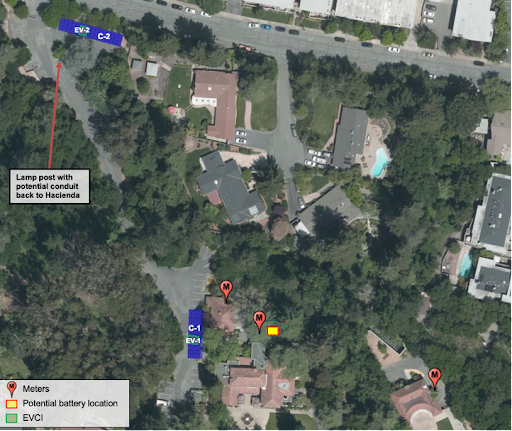
Council Chamber & Corp. Yard
Total annual load:
- Baseline load profile: 14,521 kWh
- Baseline load profile+L2: 82,032 kWh
- Master load profile: 191,532 kWh
Solar sizing by recommended location:
- R-1 (Rooftop): 6 kWdc
- C-1 (Carport): 23 kWdc
- C-2 (Carport): 32 kWdc
- TOTAL: 61 kWdc
Solar to Net Zero Energy:
- Baseline load profile: 10 kWdc
- Baseline+L2 load profile: 61kWdc
- Master load profile: 113 kWdc
Critical loads:
- 100% of baseline load is critical as is some EV charging in specific scenarios
- Town council chambers, repair facilities, and Emergency Operation Center
Electric vehicle charging:
- EV-1: Two new L2 ports for employee & municipal fleet only
- EV-2: Two new L3 ports for employee & municipal fleet only
- Estimated annual load of two new L2 ports: 67,510 kWh
- Estimated annual load of two new L3 ports managed as one port: 109,500 kWh
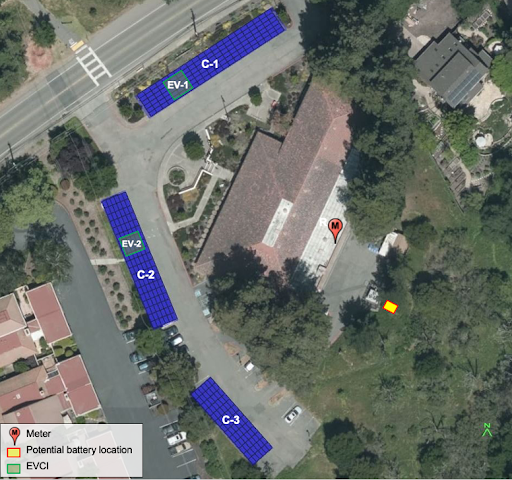
Library
Total annual load:
- Baseline load profile: 107,619 kWh
- Master load profile: 175,470 kWh
Total solar siting potential
- 176 kWdc
Solar sizing by recommended location:
- C-1 (Carport): 46.2 kWdc
- C-2 (Carport): 39.9 kWdc
- C-3 (Carport): 27.3 kWdc
- TOTAL: 113.4 kWdc
Solar to Net Zero Energy:
- Baseline load profile: 69 kWdc
- Master load profile: 113.4 kWdc
Critical loads:
- 100% of load is critical
- Can operate during outages for Town with internet, lighting, cooling/heating, plug loads
Electric vehicle charging:
- EV-1: Two new level-2 EV charging ports for employees & public
- EV-2: Two new level-2 EV charging ports for employees & public
- Estimated annual load of four new Level-2 charging ports: 67,851 kWh
Hacienda & Pavilion
Total annual load:
- Baseline load profile: 37.295 kWh
- Master load profile: 68,065 kWh
Solar sizing by recommended location:
- C-1 (Carport): 25 kWdc
- C-2 (Carport): 28 kWdc
- TOTAL: 53 kWdc
Solar to meet NZE:
- Hacienda & Pavilion baseline load profile: 27kWdc
- Hacienda & Pavilion master load profile: 53kWdc
Critical loads
- Critical load only to cover weddings, walk-in refrigerator/freezer, server, and pavilion baseline loads.
Electric vehicle charging:
- EV-1 or EV-2: Two new L2 EV charging ports for employees & public
- Estimated annual load of two new L2 charging ports – 33,926 kWh